
Candle Volume Profile Demo
지표
465 다운로드
버전 1.0, Nov 2025
Windows, Mac
4.0
리뷰: 1
설명
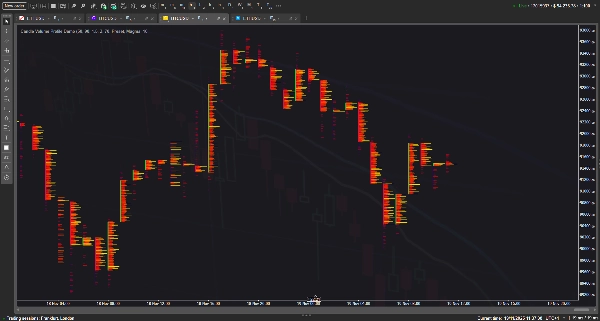
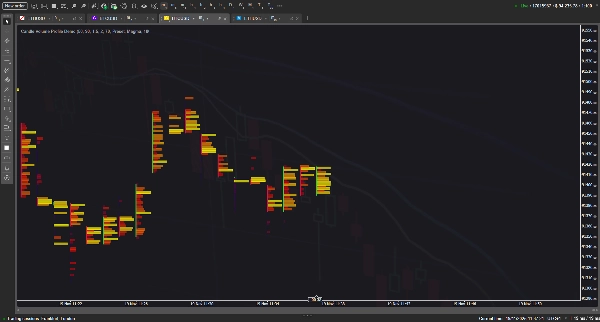
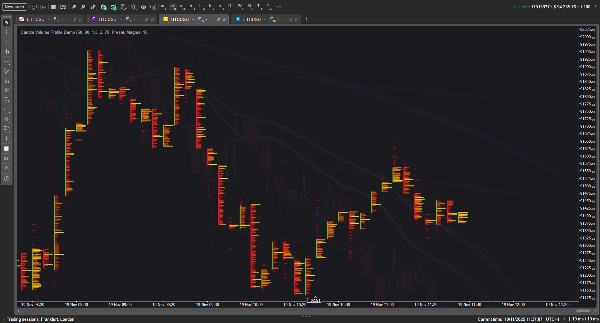
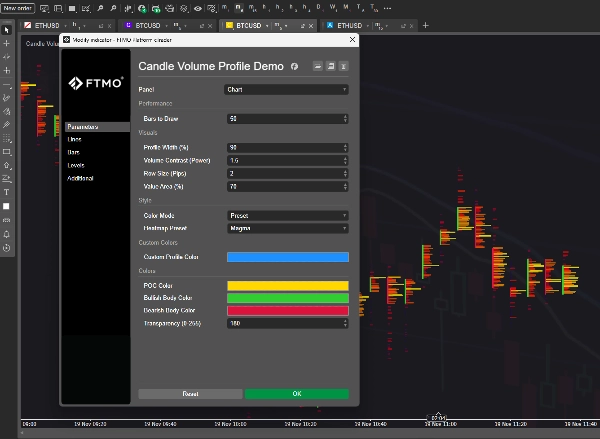
이 지표는 개별 봉에 대한 볼륨 프로파일을 시각화하여 표준 캔들스틱을 사용자 지정 가능한 히트맵, POC(포인트 오브 컨트롤) 선, 가치 영역 블록이 포함된 상세한 '풋프린트' 스타일 차트로 변환하여 가격 수준별 볼륨 분포를 강조합니다. 이는 휴리스틱 볼륨 분포를 사용하여 시장 활동을 차트에 직접 렌더링함으로써 전문 주문 흐름 도구를 모방하는 것을 목표로 합니다.
이론적으로 이 개념은 심층적인 시장 통찰력을 원활하게 제공해야 하지만, 실제로는 렌더링에 필요한 방대한 수의 그래픽 객체 때문에 이 지표에서 더 많은 기능과 과거 데이터를 요구할수록 지연이 발생하고 터미널 불안정성이 증가하는 경향이 있습니다. :(
요약
AI 요약
Candle Volume Profile Demo is an indicator designed for cryptocurrency markets, specifically visualizing volume distribution within individual candlestick bars. It transforms standard candlesticks into detailed footprint-style charts by applying heuristic volume profiling techniques. Key features include customizable heatmaps, Point of Control (POC) lines, and Value Area blocks, which highlight volume concentration at specific price levels. This approach aims to replicate professional order flow analysis by rendering market activity directly on the price chart, providing granular insights into volume dynamics per bar. The indicator supports BTCUSD and other crypto symbols, integrating concepts such as Fair Value Gap (FVG), ZigZag patterns, ATR, and VWAP for enhanced volume and volatility context. Users can adjust visualization parameters to explore volume profiles over different historical depths, though extensive feature use may impact performance due to graphical complexity. This tool is intended for traders seeking detailed volume-based market structure analysis within crypto trading environments.
지표 프로필
고객 리뷰
4.0
리뷰: 1
5 | 0 % | |
4 | 100 % | |
3 | 0 % | |
2 | 0 % | |
1 | 0 % |
고객 리뷰
November 24, 2025
Candle Volume Profile Demo gives you a clean visual of volume distribution inside candles/ranges - a smart add-on for liquidity-aware traders. The visualization is sharp and performance solid, but as a demo version it lacks full features (history logs, advanced filters). Best when paired with structure and confirmation tools. A good starting point, ready to level up.
상담
자주 묻는 질문(FAQ)
BTCUSD
Signal
ZigZag
Fair Value Gap
Crypto
ATR
VWAP
트레이딩 봇, 지표, 플러그인 등 cTrader Store에서 제공되는 상품은 제3자 개발자에 의해 제공되며, 이는 단순히 정보 및 기술적 접근을 목적으로 제공된 것입니다. cTrader Store는 중개인이 아니며, 투자 조언, 개인별 추천 또는 향후 성과에 대한 어떠한 보장도 제공하지 않습니다.


!["[Stellar Strategies] Smart ADX" 로고](https://cdn.ctrader.com/image/webp/af13b084-b6f6-41db-b7bc-c7e688b57b05_36929)


가격
가입일 26/05/2025
388.58M
거래량
60.75K
핍 수익
15
판매
1.41K
무료 설치