
VolumeThermometer
지표
420 다운로드
버전 1.0, Aug 2025
Windows, Mac
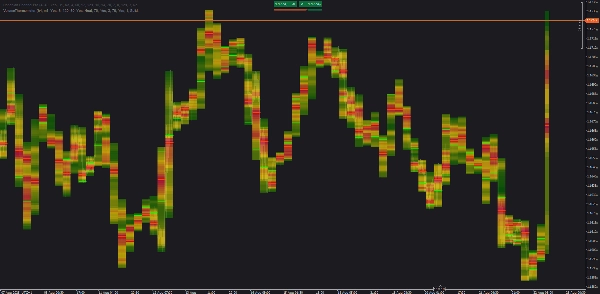
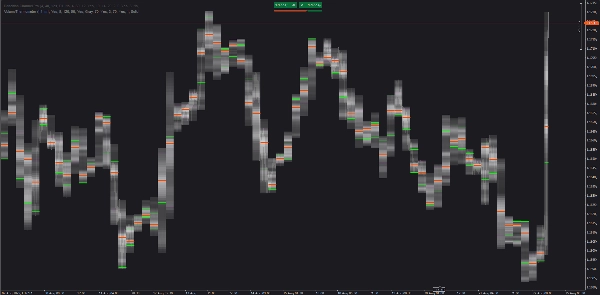
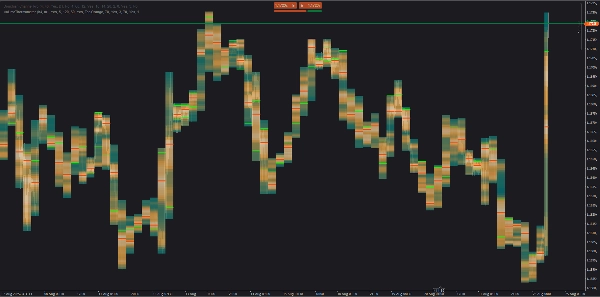
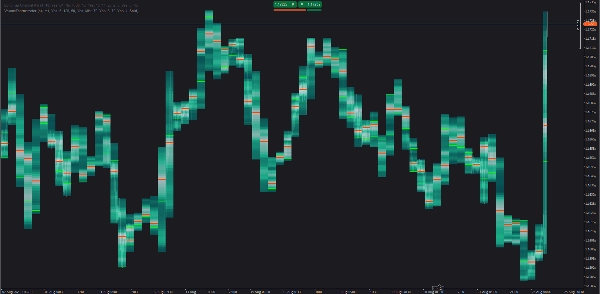
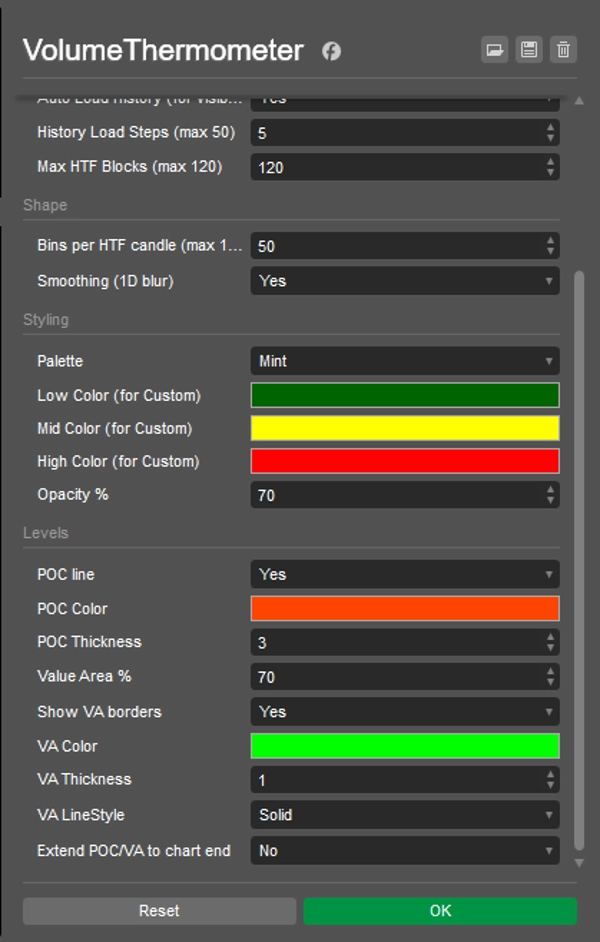
cTrader 히트맵으로 볼륨이 어떻게 분포되는지 보여줍니다 각 HTF 캔들 내에서. LTF 바(예: M1)를 사용하여 수직 볼륨 구간을 만들고, POC 및 Value Area (VA) 선을 그립니다. 현재(완성되지 않은) HTF 캔들은 실시간으로 표시됩니다.
작동 방식
- LTF 바에서 틱 볼륨을 집계합니다.
- 각 HTF 캔들을
Bins가격 구간으로 나누고 가격 겹침에 따라 볼륨을 할당합니다. - 상대 볼륨에 따라 구간에 색을 칠하고; POC, 선택적 VA 선을 그리며, 오른쪽으로 연장할 수 있습니다.
- 오래된 기록은 보이는 범위에 대해서만 자동으로 불러옵니다(작은 배치 단위).
사용 방법
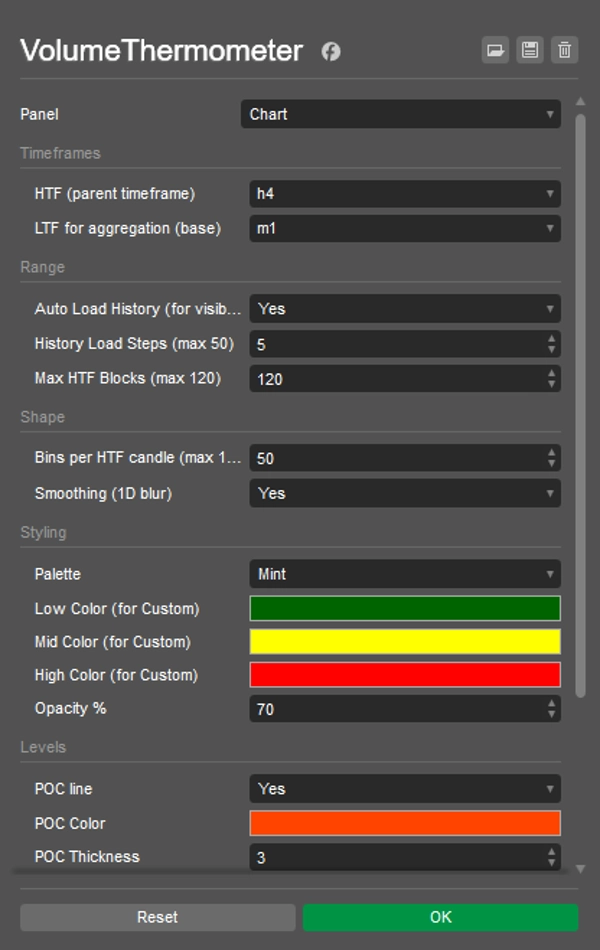
- HTF(예: H4)와 LTF(예: M1)를 선택합니다.
- 자동 기록 불러오기를 활성화하고; 원하는 범위로 스크롤/확대합니다.
- Bins(세부사항), 최대 HTF 블록(표시할 캔들 수), 스무딩, 불투명도 및 색상을 조정합니다.
- POC/VA 반응과 POC가 캔들마다 어떻게 이동하는지 관찰합니다.
간단한 아이디어
- POC 재시험: 이전 POC를 처음 터치하고 LTF 확인이 동반됩니다.
- VA 회전: VA로 재진입하면 종종 POC/다른 VA 가장자리를 목표로 합니다.
- LVN 통과: 얇은(차가운) 구간은 다음 노드로 빠르게 이동하는 경향이 있습니다.
참고
- 틱 볼륨을 사용합니다 (FX/CFD에서 좋은 대리 지표이며, 거래소 볼륨은 아닙니다).
- 성능을 위해 필요하면 Bins 또는 최대 HTF 블록을 줄이세요.
지표 프로필
0.0
리뷰: 0
고객 리뷰
이 상품에 대한 리뷰가 아직 없습니다. 이미 사용해 보셨나요? 다른 사람들에게 가장 먼저 소개해 주세요!
BTCUSD
Prop
Forex
Indices
EURUSD
Commodities
Crypto
Stocks
NAS100
트레이딩 봇, 지표, 플러그인 등 cTrader Store에서 제공되는 상품은 제3자 개발자에 의해 제공되며, 이는 단순히 정보 및 기술적 접근을 목적으로 제공된 것입니다. cTrader Store는 중개인이 아니며, 투자 조언, 개인별 추천 또는 향후 성과에 대한 어떠한 보장도 제공하지 않습니다.


좋아하실 만한 다른 항목

!["Gaussian Channel [Iridio Capital]" 로고](https://cdn.ctrader.com/image/webp/7c039209-5573-4a54-a072-f9528b503103_41960)

!["[Stellar Strategies] Market Session Ultimate" 로고](https://cdn.ctrader.com/image/webp/61ffd537-0125-4246-9e72-42eca1791d64_28232)


가입일 26/05/2025
380.18M
거래량
60.65K
핍 수익
14
판매
1.38K
무료 설치