
Zero Lag Exponential Moving Average
مؤشر
258 التنزيلات
الإصدار 1.0، Aug 2025
Windows, Mac
الوصف
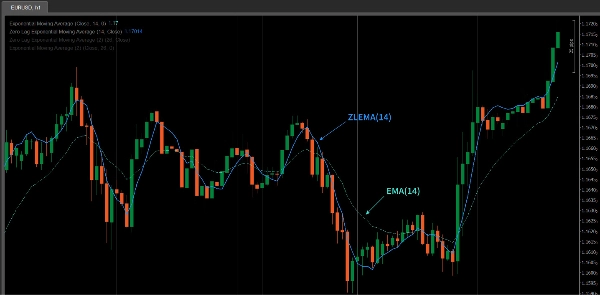
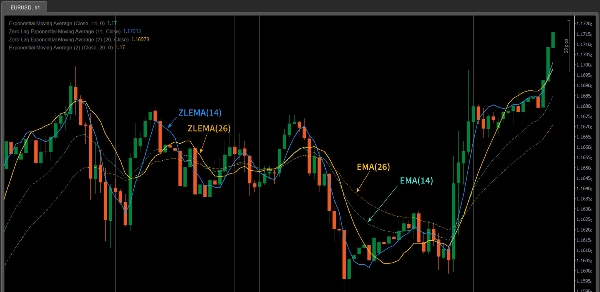
الZLEMA (متوسط الحركة الأسي بدون تأخير) هو نسخة متقدمة من المتوسط المتحرك الأسي (EMA) مصمم لتقليل التأخير المرتبط عادةً بالمتوسطات المتحركة الأسي التقليدية. باستخدام طريقة حساب متخصصة، يستجيب ZLEMA بسرعة أكبر لتغيرات الأسعار، مما يجعله فعالًا بشكل خاص في الأسواق المتقلبة.
الميزة الرئيسية لـ ZLEMA هي خاصية "عدم التأخير" الخاصة به، مما يسمح له بمتابعة تحركات الأسعار بشكل أدق، خصوصًا في ظروف السوق سريعة الحركة. مقارنةً بالمتوسط المتحرك الأسي التقليدي، يقدم ZLEMA أوقات استجابة أسرع، مما يجعله أكثر ملاءمة لالتقاط اتجاهات السوق في الوقت المناسب.
ZLEMA مقابل EMA
- سرعة الاستجابة: يستجيب ZLEMA أسرع من المتوسط المتحرك الأسي التقليدي. من خلال تعويض التأخير، يتابع تغيرات الأسعار بشكل أسرع.
- تأثير التنعيم: يحافظ ZLEMA على تأثير التنعيم المشابه لـ EMA، مع تقليل تأخير السعر، مما يجعله أكثر ملاءمة للأسواق سريعة الحركة.
- حالة الاستخدام: إذا كنت تتداول في سوق متقلب للغاية (مثل التداول قصير الأجل أو التداول داخل اليوم)، يمكن لـ ZLEMA أن يتفوق على EMA من حيث الاستجابة.
ميزات مؤشر ZLEMA
- استجابة بدون تأخير: يقلل ZLEMA من التأخير، مما يمكنه من الاستجابة بسرعة لتقلبات أسعار السوق، مما يجعله أكثر دقة في التقاط التغيرات السريعة في السوق.
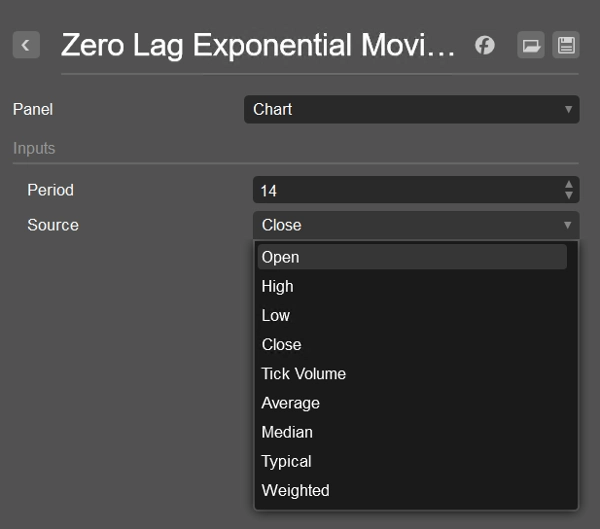
- النعومة: بالرغم من تقديمه استجابة أسرع، يحتفظ ZLEMA بتأثير التنعيم الخاص بـ EMA، مما يساعد على تجنب الضوضاء الناتجة عن تقلبات الأسعار.
- المرونة: يمكن استخدام ZLEMA مع مصادر بيانات سعر مختلفة (مثل
الإغلاق،الفتح،الأعلى، إلخ)، مما يسمح للمتداولين بضبطه بناءً على احتياجات استراتيجيتهم. - متابعة الاتجاه وتأكيد إشارات الانعكاس: يعد ZLEMA مثاليًا لتحديد تغيرات الاتجاه، خاصة في الأسواق المتقلبة، وتأكيد إشارات انعكاس السعر.
كيفية استخدام مؤشر ZLEMA
- المتداولون قصيرو الأجل: ZLEMA مثالي للمتداولين قصيري الأجل لأنه يمكنه الاستجابة بسرعة لتقلبات الأسعار. رد فعله السريع يجعله مثاليًا لالتقاط انعكاسات الاتجاه قصيرة الأجل أو إشارات الاختراق.
- متابعة الاتجاه: يمكن أيضًا استخدام ZLEMA لتتبع الاتجاهات طويلة الأجل لكنه يقدم حساسية أكبر من EMA. في الاتجاه القوي، يساعد ZLEMA على تحديد بداية أو نهاية الاتجاهات بسرعة أكبر، مما يساعد في تعديل الاستراتيجية في الوقت المناسب.
- الدمج مع مؤشرات أخرى: يعمل ZLEMA بشكل جيد عند دمجه مع مؤشرات فنية أخرى مثل RSI، MACD، أو تحليل أنماط الأسعار لتعزيز دقة الإشارات. وهو مفيد بشكل خاص عند دمجه مع مؤشرات متابعة الاتجاه مثل المتوسطات المتحركة لتأكيد اختراقات الأسعار أو الانعكاسات.
- تأكيد الاختراقات والانعكاسات: يمكن لـ ZLEMA المساعدة في تأكيد اختراقات الأسعار من المستويات الرئيسية أو إشارات الانعكاس. على سبيل المثال، عندما يعبر السعر خط ZLEMA، قد يشير ذلك إلى تغير في الاتجاه، والعكس صحيح.
- تقليل الضوضاء: بسبب تقليل التأخير، يكون ZLEMA أفضل في تصفية الضوضاء التي قد تكون موجودة في المتوسطات المتحركة التقليدية، مما يجعله أداة مهمة في التداول داخل اليوم أو الأسواق شديدة التقلب.
نصائح لاستخدام ZLEMA
- تعديل الفترة: قم بتعديل فترة ZLEMA بناءً على أسلوب تداولك وتقلبات السوق. للتداولات قصيرة الأجل، استخدم فترة أقصر (مثل 10 أو 14)، بينما لتتبع الاتجاهات طويلة الأجل، قد تكون الفترة الأطول (مثل 50 أو 100) أكثر ملاءمة.
- الدمج مع أدوات أخرى: بينما يوفر ZLEMA قدرات ممتازة لمتابعة الاتجاه، فإن دمجه مع مؤشرات أخرى مثل RSI لحالات الشراء أو البيع المفرط أو MACD لقوة الاتجاه يمكن أن يحسن الدقة.
- الاختبار والتحسين: قد تختلف أداء ZLEMA عبر ظروف السوق المختلفة. يُنصح بإجراء اختبار رجعي وتحسينه بدقة قبل استخدامه في التداول الحي لضمان أفضل النتائج في استراتيجيتك.
الملخص
ملخص الذكاء الاصطناعي
The Zero Lag Exponential Moving Average (ZLEMA) is an advanced technical indicator designed to improve upon the traditional Exponential Moving Average (EMA) by reducing lag. It achieves faster response times to price changes while maintaining the smoothing effect of EMA, making it suitable for capturing quick market shifts and trends, especially in volatile or fast-moving markets.
Key features include:
- Zero lag response for timely reaction to price fluctuations.
- Smoothness that filters out noise without sacrificing responsiveness.
- Flexibility to use various price data inputs such as Close, Open, or High prices.
- Utility in trend following and confirming reversal signals.
ZLEMA is particularly useful for short-term traders seeking to capture rapid trend reversals or breakouts, as well as for longer-term trend tracking with enhanced sensitivity compared to EMA. It can be combined with other indicators like RSI or MACD to improve signal accuracy and confirm price breakouts or reversals.
Users can adjust the indicator’s period to match their trading style and market conditions, optimizing performance through backtesting. ZLEMA helps reduce noise and lag, making it a valuable tool for intraday and volatile market trading.
ملف تعريف المؤشر
تقييمات العملاء
0.0
التقييمات: 0
تقييمات العملاء
لا توجد تقييمات لهذا المنتج حتى الآن. هل جرَّبته بالفعل؟ كن أول من يخبر الآخرين!
مناقشة
الأسئلة الشائعة
يتم توفير المنتجات المتاحة من خلال cTrader Store، بما في ذلك روبوتات التداول والمؤشرات والإضافات، من قبل مطوري الطرف الثالث وإتاحتها لأغراض الوصول المعلوماتي والفني فقط. cTrader Store ليس وسيطًا ولا يقدم نصائح استثمارية أو توصيات شخصية أو أي ضمان للأداء المستقبلي.
قد يعجبك أيضًا


السعر
منذ 14/07/2025
258
التثبيتات المجانية