
Mô tả
Cách Giao Dịch Sử Dụng Chiến Lược Donchian (Phá Vỡ)
- Mua khi giá phá vỡ mức cao trong N kỳ (Kênh trên).
- Bán khi giá phá vỡ mức thấp trong N kỳ (Kênh dưới).
- Giữ vị thế trong khi xu hướng tiếp tục; thoát khi có phá vỡ ngược lại hoặc qua dừng lỗ theo sau.
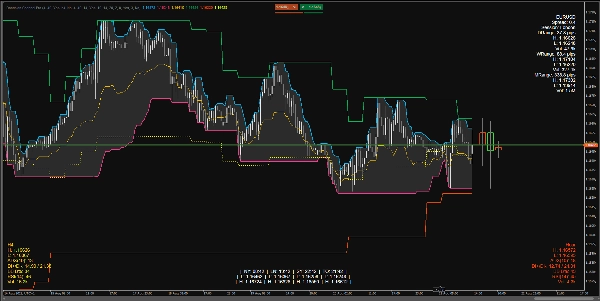
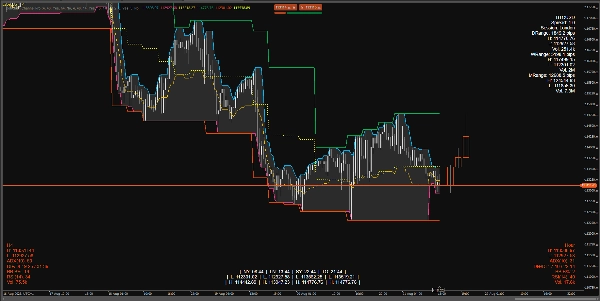
Chỉ Báo Hiển Thị Gì Trên Biểu Đồ
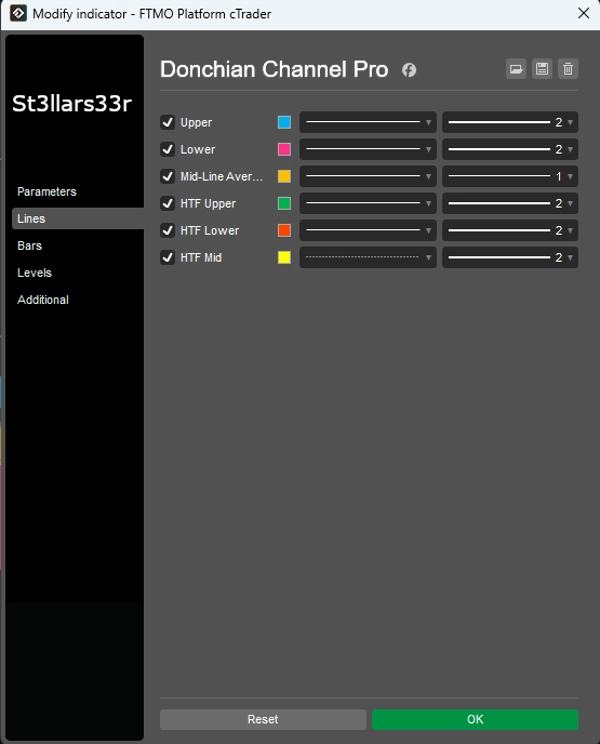
Donchian trên Khung Thời Gian Hiện Tại (TF):
- Kênh Trên: Giá cao nhất trong các thanh Kênh Trên.
- Kênh Dưới: Giá thấp nhất trong các thanh Kênh Dưới.
- Giữa: Điểm giữa giữa Kênh Trên và Kênh Dưới.
Lớp Phủ HTF: Các đường Donchian từ khung thời gian cao hơn phủ lên biểu đồ:
- Kênh Trên HTF, Kênh Dưới HTF, Giữa HTF
- HUD Nến HTF: Các hình chữ nhật đại diện cho nến khung thời gian cao hơn, neo ở bên phải thanh cuối cùng trên TF hiện tại.
HUDs (Hiển Thị Đầu) ở Dưới/Cạnh Trên:
- Phía Trên Phải: Bảng thông tin cho ký hiệu + phạm vi hàng ngày/tuần/tháng.
- Phía Dưới Trái: HUD HTF (các chỉ số cho khung thời gian cao hơn).
- Phía Dưới Phải: HUD TF Trung Gian (các chỉ số cho khung thời gian trung gian).
- Giữa Dưới: Đồng hồ phiên + Cao/Thấp cho mỗi phiên (liên tục).
Mỗi HUD Hiển Thị Gì
Phía Trên Phải (Top Right)
- Tên Ký Hiệu
- Chênh Lệch: Chênh lệch tính bằng pip.
- Phiên: Phiên hiện đang hoạt động (dựa trên giờ đã chỉ định).
- Phạm Vi D/W/M: Phạm vi hàng ngày/tuần/tháng tính bằng pip.
- Cao/Thấp/Khối Lượng: Mức cao/thấp và tổng khối lượng cho khoảng thời gian tương ứng.
Phía Dưới Trái (Bottom Left) — HUD HTF
- Tên TF (ví dụ, H4, D1, v.v.)
- Cao/Thấp: Mức cao/thấp hiện tại của thanh HTF cuối cùng (hoặc đang hoạt động).
- ADX(n), DI+/DI-: Các chỉ báo xu hướng.
- BB B%: Vị trí giá hiện tại so với Dải Bollinger trên HTF (0 gần dải dưới, 100 gần dải trên).
- RSI(n)
- Khối Lượng: Khối lượng trên HTF.
- Màu HUD:
-
- Xanh Lá: Phạm vi mở rộng lên trên (DI+ và ADX tăng).
- Đỏ: Áp lực giảm tăng lên (DI- tăng).
- Vàng: Trung lập/không xác định.
Phía Dưới Phải (Bottom Right) — HUD TF Trung Gian
- Giống như HUD HTF, nhưng dành cho khung thời gian trung gian (Mid Timeframe).
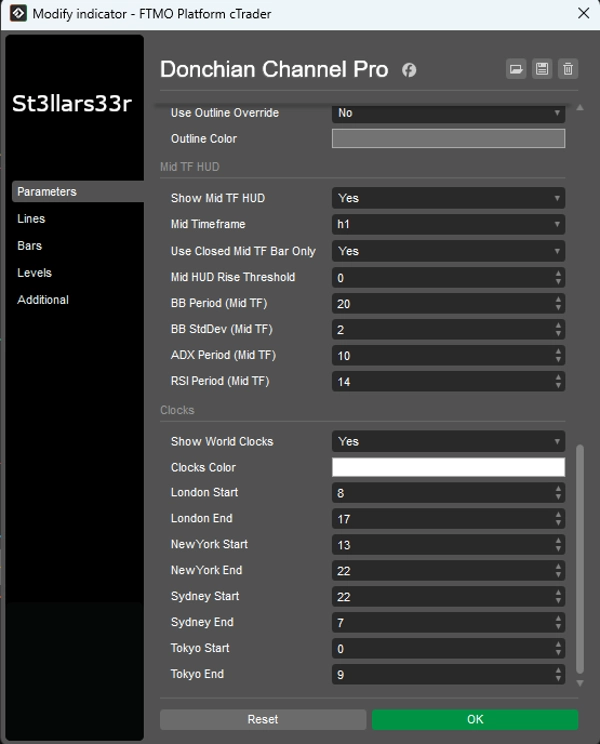
Giữa Dưới (Bottom Center) — Đồng Hồ + Cao/Thấp Phiên
- Thời Gian ở NY, LN, SY, TO.
- Thấp/Cao cho mỗi phiên.
- Logic Liên Tục: Khi phiên không hoạt động, hiển thị Cao/Thấp của phiên đã hoàn thành cuối cùng; khi phiên mới bắt đầu, các giá trị được đặt lại và tính toán lại.
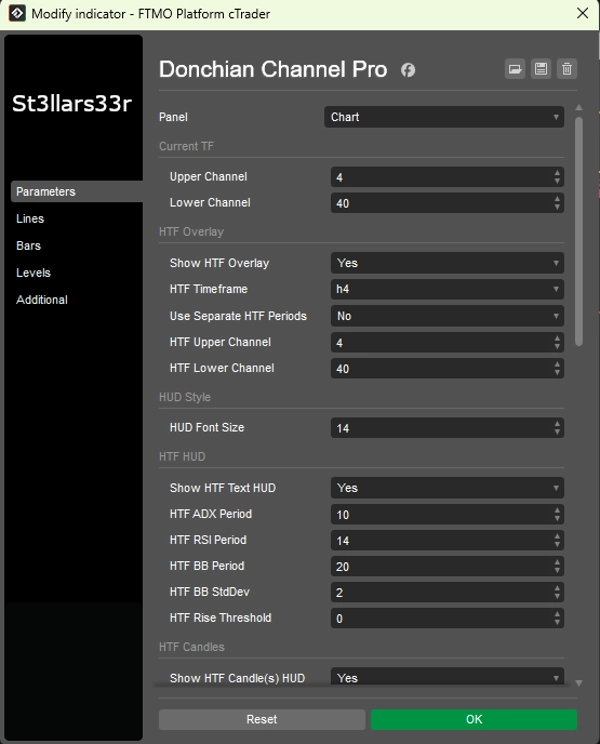
Các Tham Số và Cách Sử Dụng Chúng
Nhóm: TF Hiện Tại (Donchian Hiện Tại)
- Kênh Trên: Số thanh cho kênh trên. Giá trị lớn hơn = cập nhật ít hơn, đường phẳng hơn.
- Kênh Dưới: Số thanh cho kênh dưới.
Nhóm: Lớp Phủ HTF (Lớp Phủ Donchian Khung Thời Gian Cao Hơn)
- Hiển Thị Lớp Phủ HTF: Bật các đường HTF trên biểu đồ.
- Khung Thời Gian HTF: Chọn khung thời gian cao hơn (ví dụ, Hour4).
- Sử Dụng Các Khoảng Thời Gian HTF Riêng Biệt: Nếu đúng, Kênh Trên/Dưới HTF sử dụng tham số riêng; nếu sai, dùng Kênh Trên/Dưới hiện tại.
- Kênh Trên HTF: Độ dài kênh trên cho HTF.
- Kênh Dưới HTF: Độ dài kênh dưới cho HTF.
Nhóm: Phong Cách HUD
- Kích Thước Phông Chữ HUD: Kích thước phông chữ cho tất cả HUD (Phía Trên Phải, Phía Dưới Trái, Phía Dưới Phải, Giữa Dưới).
Nhóm: HUD HTF (Phía Dưới Trái)
- Hiển Thị HUD Văn Bản HTF: Hiển thị HUD văn bản cho HTF.
- Chu Kỳ ADX HTF: Chu kỳ ADX/DI. Giá trị lớn hơn = mượt hơn, ít nhiễu hơn, nhưng phản ứng chậm hơn.
- Chu Kỳ RSI HTF: Chu kỳ RSI.
- Chu Kỳ BB HTF: Chu kỳ Dải Bollinger.
- Độ Lệch Chuẩn BB HTF: Hệ số độ lệch chuẩn cho BB (mặc định là 2.0).
- Ngưỡng Tăng HTF: Độ nhạy với các chỉ số tăng (ảnh hưởng màu HUD).
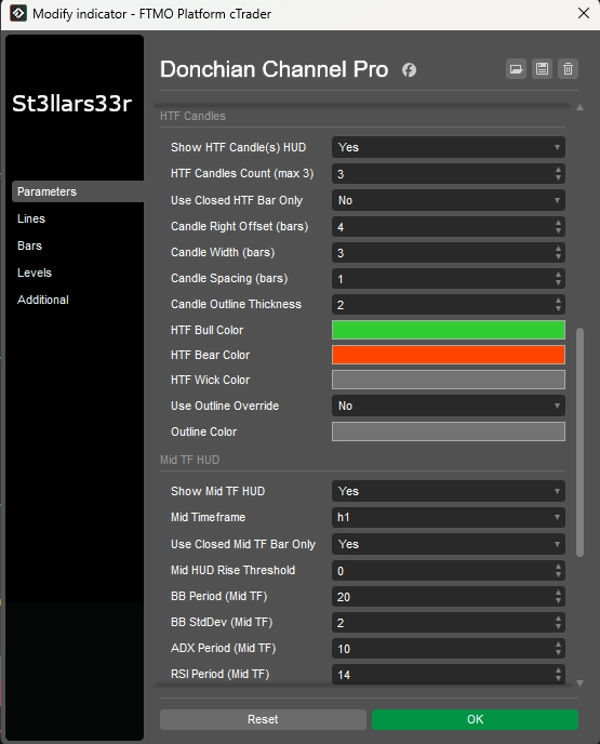
Nhóm: Nến HTF (Bên Phải, Gần Thanh Cuối)
- Hiển Thị HUD Nến HTF: Hiển thị nến HTF bên phải.
- Số Lượng Nến HTF (tối đa 3): Số lượng nến HTF (1–3).
- Chỉ Sử Dụng Thanh HTF Đóng: Nếu đúng, chỉ dùng nến HTF đã đóng (giá trị ổn định). Nếu sai, bao gồm nến hiện tại đang mở.
- Độ Dịch Bên Phải Của Nến (thanh): Độ dịch sang phải tính bằng thanh của TF hiện tại từ thanh cuối cùng (neo).
- Chiều Rộng Nến (thanh): Chiều rộng hình chữ nhật nến tính bằng thanh TF hiện tại.
- Khoảng Cách Giữa Các Nến (thanh): Khoảng cách giữa các nến.
- Độ Dày Viền Nến: Độ dày của viền nến.
- Màu Bull HTF / Màu Bear HTF: Màu sắc cho nến tăng/giảm.
- Màu Bấc HTF: Màu cho bấc nến.
- Sử Dụng Ghi Đè Viền: Nếu đúng, thân nến được vẽ với viền (Màu Viền) mà không có màu nền bull/bear.
- Màu Viền: Màu cho viền khi Sử Dụng Ghi Đè Viền = đúng.
Nhóm: HUD TF Trung Gian (Phía Dưới Phải)
- Hiển Thị HUD TF Trung Gian: Bật HUD cho TF trung gian.
- Khung Thời Gian Trung Gian: Chọn TF trung gian (ví dụ, Minute15).
- Chỉ Sử Dụng Thanh TF Trung Gian Đóng: Giống như HTF, nhưng dành cho TF Trung Gian.
- Ngưỡng Tăng HUD Trung Gian: Độ nhạy màu cho HUD TF Trung Gian.
- Chu Kỳ BB (TF Trung Gian), Độ Lệch Chuẩn BB (TF Trung Gian): Cài đặt Dải Bollinger cho TF Trung Gian.
- Chu Kỳ ADX (TF Trung Gian), Chu Kỳ RSI (TF Trung Gian): Chu kỳ ADX và RSI cho TF Trung Gian.
Nhóm: Đồng Hồ (Giữa Dưới)
- Hiển Thị Đồng Hồ Thế Giới: Hiển thị khối với đồng hồ và Cao/Thấp phiên.
- Màu Đồng Hồ: Màu chữ cho đồng hồ/phiên.
- Bắt Đầu London / Kết Thúc London: Giờ bắt đầu/kết thúc phiên London.
- Bắt Đầu NewYork / Kết Thúc NewYork: Cho New York.
- Bắt Đầu Sydney / Kết Thúc Sydney: Cho Sydney.
- Bắt Đầu Tokyo / Kết Thúc Tokyo: Cho Tokyo.
Đồng Hồ: Hiển thị giờ địa phương thực tế cho các thành phố (qua múi giờ hệ điều hành với độ dịch dự phòng).
- Tính toán hoạt động phiên (và Cao/Thấp) sử dụng giờ máy chủ môi giới (Server.Time). Nếu máy chủ không ở UTC, giờ phiên có thể dịch chuyển—điều chỉnh Bắt Đầu/Kết Thúc theo máy chủ của bạn.
- Nếu một phiên vượt qua nửa đêm (Kết Thúc < Bắt Đầu), chỉ báo tự động tính đến chuyển đổi ngày.
- Khi phiên không hoạt động, hiển thị Cao/Thấp của phiên đã hoàn thành cuối cùng; khi phiên mới bắt đầu, dữ liệu được đặt lại và tính toán lại.
Tóm tắt
Đánh giá của khách hàng
5 | 50 % | |
4 | 50 % | |
3 | 0 % | |
2 | 0 % | |
1 | 0 % |


