
Mô tả
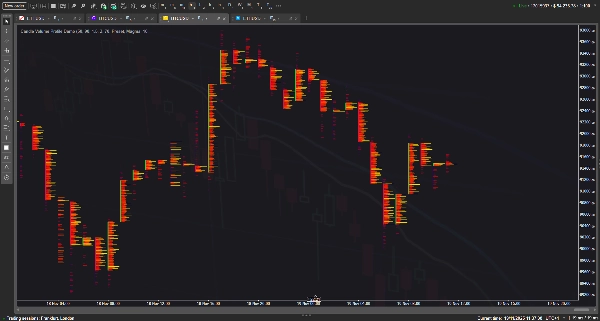
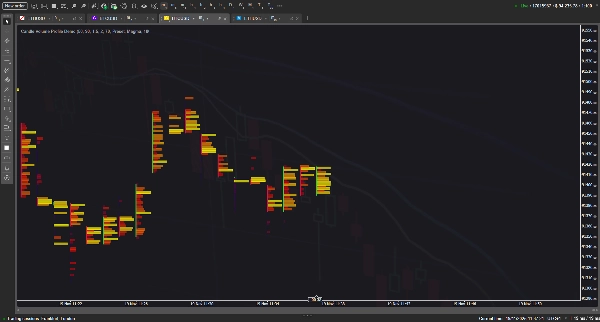
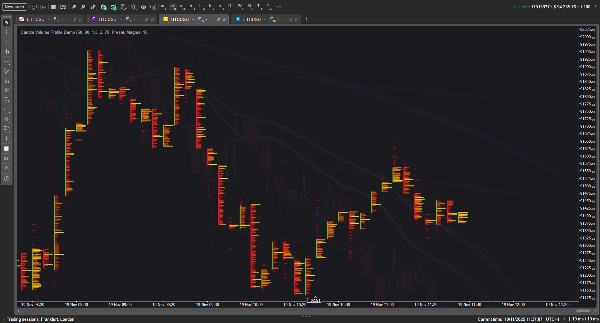
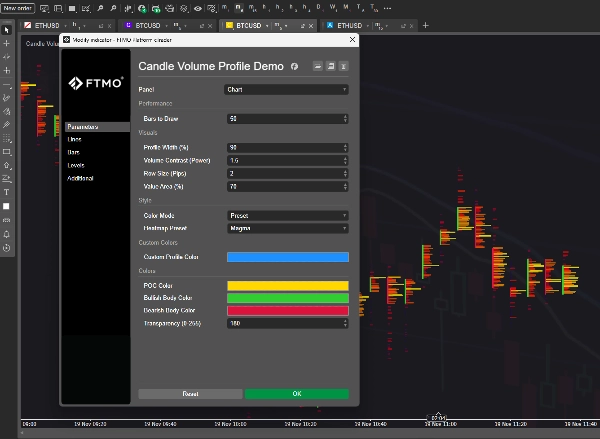
Chỉ báo này trực quan hóa Hồ sơ Khối lượng cho từng thanh riêng lẻ, biến các cây nến tiêu chuẩn thành biểu đồ kiểu 'dấu chân' chi tiết với các bản đồ nhiệt có thể tùy chỉnh, các đường Điểm Kiểm soát (POC) và các khối Khu vực Giá trị để làm nổi bật phân bố khối lượng theo từng mức giá. Nó nhằm mô phỏng các công cụ luồng lệnh chuyên nghiệp bằng cách sử dụng phân bố khối lượng suy luận để hiển thị hoạt động thị trường trực tiếp trên biểu đồ.
Về lý thuyết, khái niệm này nên hoạt động trơn tru để cung cấp cái nhìn sâu sắc về thị trường; tuy nhiên, trong thực tế, do số lượng lớn các đối tượng đồ họa cần thiết để hiển thị, càng nhiều tính năng và độ sâu lịch sử bạn yêu cầu từ chỉ báo này, nó càng có xu hướng bị trễ và gây ra sự không ổn định cho terminal. :(
Tóm tắt
Đánh giá của khách hàng
5 | 0 % | |
4 | 100 % | |
3 | 0 % | |
2 | 0 % | |
1 | 0 % |


