
Side Volume Profile
Chỉ báo
11 lượt mua
Phiên bản 1.0, Aug 2025
Windows, Mac
4.3
Đánh giá: 3
Kể từ 26/05/2025
385.09M
Khối lượng đã giao dịch
60.66K
Pip đạt được
14
Lượt bán
1.4K
Cài đặt miễn phí
Mô tả
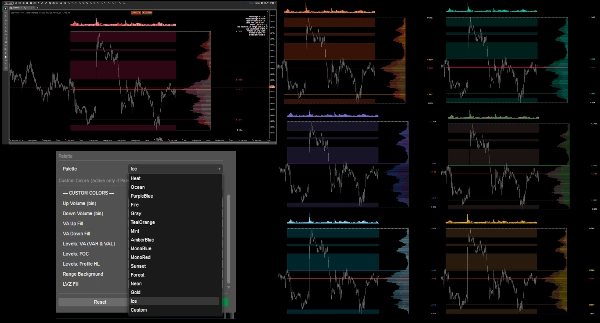
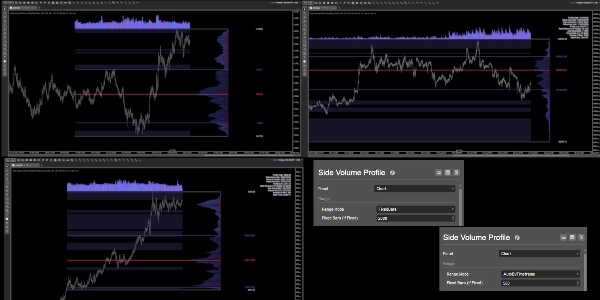
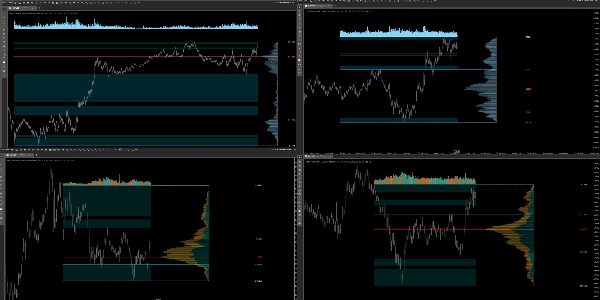
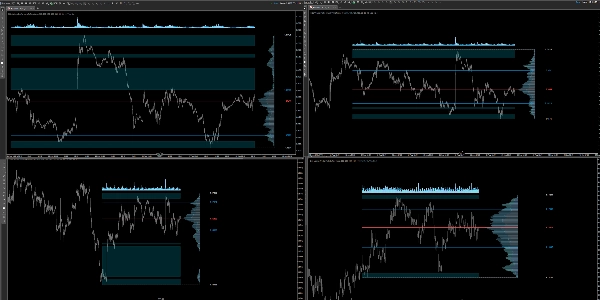
Một Hồ sơ Khối lượng bên phải, luôn được ghim vào các thanh cuối cùng và không nhảy khi bạn di chuyển biểu đồ. Nó tính toán khối lượng theo giá trên một phạm vi đã chọn (tự động theo khung thời gian hoặc số thanh cố định), hiển thị POC, VAH/VAL, giới hạn hồ sơ (Cao/Thấp), làm nổi bật các vùng khối lượng thấp (LVZ), và vẽ biểu đồ khối lượng với EMA phía trên phạm vi (độ lệch tính bằng pip). Bao gồm một bảng thống kê ở góc trên bên phải, nhiều bảng màu tương phản cao cùng màu tùy chỉnh, độ mờ toàn cục của bin, điều khiển chiều rộng/độ lệch, và độ dày/phong cách từng dòng. Được xây dựng để dễ đọc và hiệu suất cao.
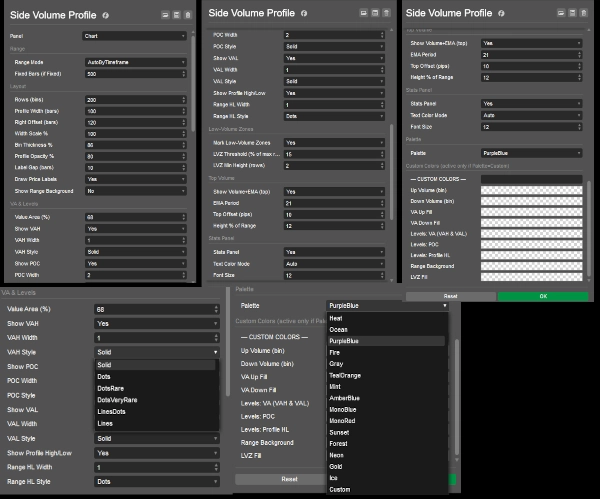
- Phạm vi: Tự động theo khung thời gian hoặc số thanh cố định.
- Bố cục: Hàng (bin), Chiều rộng Hồ sơ / Tỷ lệ Chiều rộng, Độ lệch bên phải, Độ dày bin, Khoảng cách nhãn, độ mờ hồ sơ; nền phạm vi tùy chọn.
- VA & Mức: Phần trăm Khu vực Giá trị, bật tắt VAH/POC/VAL, độ dày & phong cách đường từng mức; Cao/Thấp của hồ sơ.
- Vùng Khối lượng Thấp: Ngưỡng (% của hàng tối đa) và chiều cao tối thiểu (số hàng).
- Khối lượng Cao nhất: Chu kỳ EMA, chiều cao (% của phạm vi), độ lệch mặc định 10 pip.
- Bảng màu/Tùy chỉnh: Chọn chủ đề hoặc đặt màu riêng (VAH = VAL).
- Bảng Thống kê: Bật tắt, kích thước phông chữ
Tài liệu hướng dẫn của chỉ báo
Tóm tắt
Tóm tắt AI
Side Volume Profile is a right-anchored volume profile indicator designed for cTrader that displays volume-by-price data over a selectable range, either automatically by timeframe or a fixed number of bars. It visualizes key volume levels including Point of Control (POC), Value Area High (VAH), Value Area Low (VAL), and profile bounds (high/low). The indicator highlights low-volume zones (LVZ) based on configurable thresholds and minimum heights. It also features a volume histogram with an exponential moving average (EMA) offset in pips above the profile range.
Users can customize the layout with controls for row bins, profile width and scale, right offset, bin thickness, label gaps, and opacity. Line widths and styles for VAH, POC, VAL, and profile bounds are adjustable. Multiple high-contrast color palettes and custom color options are available. A toggleable top-right statistics panel provides summary data with adjustable font size.
The indicator supports various markets including Forex, indices, commodities, cryptocurrencies, and stocks, with tags referencing symbols like BTCUSD, EURUSD, GBPUSD, XAUUSD, NAS100, and USDJPY. It is built for readability and performance, maintaining a stable position on the chart without shifting when panning.
Hồ sơ chỉ báo
Đánh giá của khách hàng
4.3
Đánh giá: 3
5 | 33 % | |
4 | 67 % | |
3 | 0 % | |
2 | 0 % | |
1 | 0 % |
Đánh giá của khách hàng
Thảo luận
Câu hỏi thường gặp
BTCUSD
Forex
Indices
EURUSD
Commodities
GBPUSD
NZDUSD
Prop
Fair Value Gap
SMC
Crypto
Stocks
XAUUSD
NAS100
USDJPY
VWAP
Các sản phẩm có sẵn trên cTrader Store, bao gồm bot giao dịch, chỉ báo và plugin, được cung cấp bởi các nhà phát triển bên thứ ba và chỉ nhằm mục đích cung cấp thông tin và tiếp cận kỹ thuật. cTrader Store không phải là nhà môi giới và không cung cấp lời khuyên đầu tư, khuyến nghị cá nhân hay bất kỳ đảm bảo nào về hiệu suất trong tương lai.


Giá
Kể từ 26/05/2025
385.09M
Khối lượng đã giao dịch
60.66K
Pip đạt được
14
Lượt bán
1.4K
Cài đặt miễn phí