
Market Entropy
Chỉ báo
107 lượt tải
Phiên bản 1.0, Aug 2025
Windows, Mac
Kể từ 26/05/2025
388.58M
Khối lượng đã giao dịch
60.75K
Pip đạt được
15
Lượt bán
1.41K
Cài đặt miễn phí
Mô tả
Market Entropy là một chỉ báo kép (bộ dao động + lớp phủ giá tùy chọn) đo lường tổ chức thị trường và báo hiệu sự thay đổi chế độ qua Trật tự → Chuyển tiếp → Hỗn loạn. Nó thêm một đường thứ hai, Trendness (DC), để phân biệt xu hướng thực sự với sự siết chặt biến động.
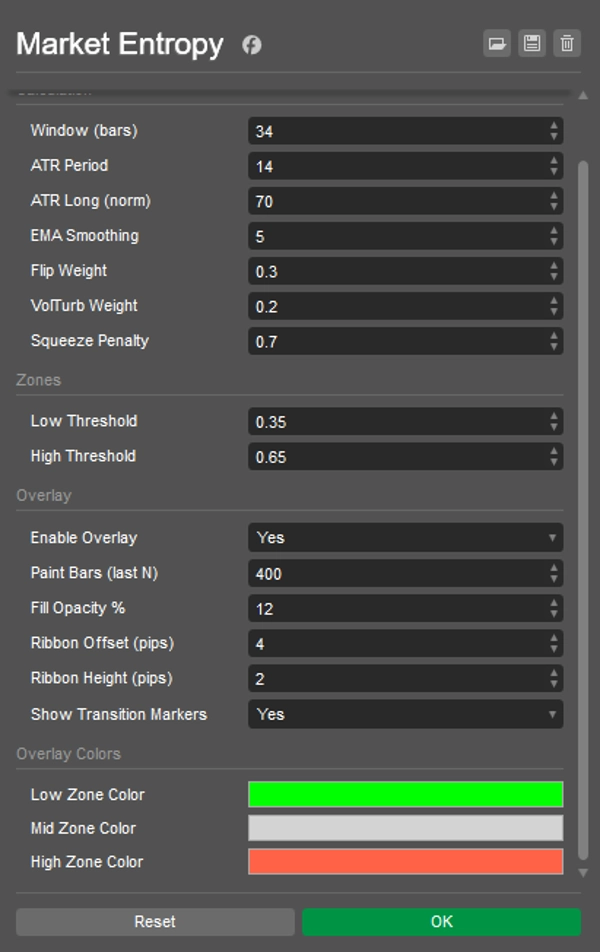
Cách hoạt động:
- Chỉ sử dụng các thành phần OHLCV: DC (độ nhất quán hướng), FlipRate (đảo dấu), Volatility_n (ATR/ATRlong), VolumeTurb (độ lệch chuẩn của ΔVolume).
- Entropy thô:
E0 = 0.5*(1-DC) + 0.3*(FlipRate*VolN) + 0.2*VolumeTurb). - Thuật ngữ chống siết giảm E trong nén ATR → cuối cùng Entropy ∈ [0..1] với làm mượt EMA.
- Các dấu hiệu:
-
- CRYSTAL — cắt xuống dưới LowThr (trật tự xuất hiện: xu hướng hoặc siết trước khi phá vỡ).
- DISSOLVE — cắt lên trên HighThr (trật tự bị phá vỡ: hỗn loạn/suy giảm xu hướng).
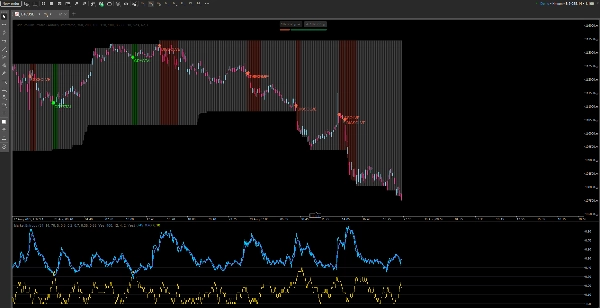
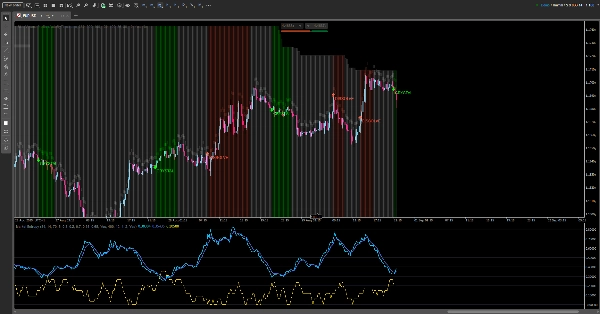
Bạn sẽ thấy:
- Trong bảng điều khiển: Entropy, Entropy(EMA), Trendness (DC), ngưỡng thấp/cao, nền vùng.
- Trên biểu đồ (có thể bật/tắt): các thanh màu trạng thái, một dải mảnh phía trên đỉnh, và các dấu hiệu CRYSTAL/DISSOLVE.
Hướng dẫn đọc:
- E < LowThr → Trật tự:
-
- với DC cao → xu hướng có tổ chức;
- với ATR thấp → siết chặt (mong đợi phá vỡ).
- LowThr…HighThr → Chuyển tiếp: cấu trúc đang hình thành; chờ đợi kết quả.
- E > HighThr → Hỗn loạn: sự không chắc chắn / xu hướng suy yếu; tránh các lệnh tiếp tục một cách ngây thơ.
Kịch bản chơi:
- Siết chặt → CRYSTAL → Phá vỡ/Retest — giao dịch theo đà phá vỡ.
- Xu hướng → DISSOLVE — thoát dần hoặc thắt chặt rủi ro.
Tóm tắt
Hồ sơ chỉ báo
Đánh giá của khách hàng
0.0
Đánh giá: 0
Đánh giá của khách hàng
Sản phẩm này chưa có đánh giá nào. Bạn đã dùng thử chưa? Hãy là người đầu tiên chia sẻ với mọi người!
Thảo luận
Câu hỏi thường gặp
Các sản phẩm có sẵn trên cTrader Store, bao gồm bot giao dịch, chỉ báo và plugin, được cung cấp bởi các nhà phát triển bên thứ ba và chỉ nhằm mục đích cung cấp thông tin và tiếp cận kỹ thuật. cTrader Store không phải là nhà môi giới và không cung cấp lời khuyên đầu tư, khuyến nghị cá nhân hay bất kỳ đảm bảo nào về hiệu suất trong tương lai.


Giá
Kể từ 26/05/2025
388.58M
Khối lượng đã giao dịch
60.75K
Pip đạt được
15
Lượt bán
1.41K
Cài đặt miễn phí