
VolumeThermometer
Chỉ báo
424 lượt tải
Phiên bản 1.0, Aug 2025
Windows, Mac
Kể từ 26/05/2025
386.5M
Khối lượng đã giao dịch
60.75K
Pip đạt được
14
Lượt bán
1.4K
Cài đặt miễn phí
Mô tả
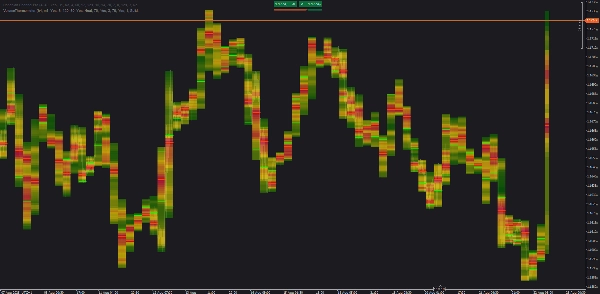
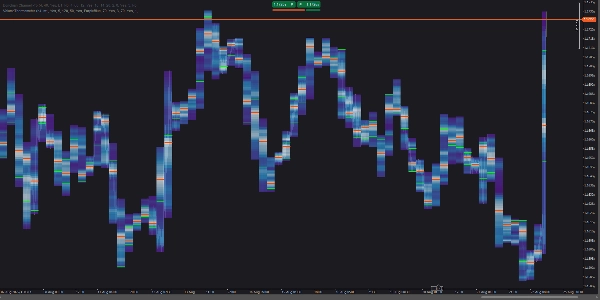
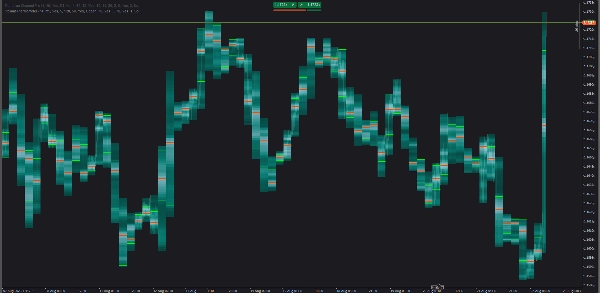
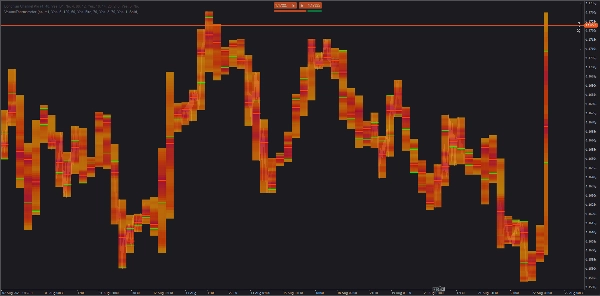
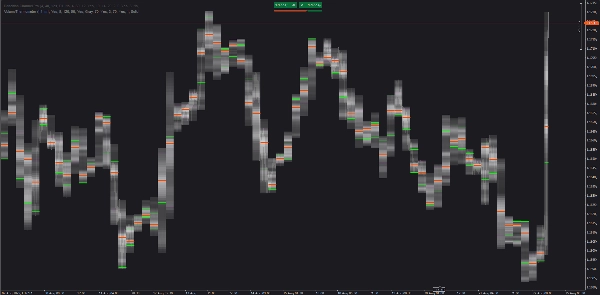
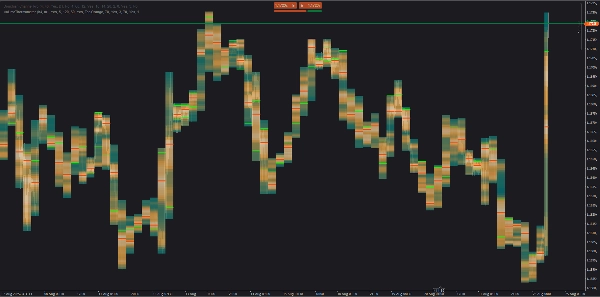
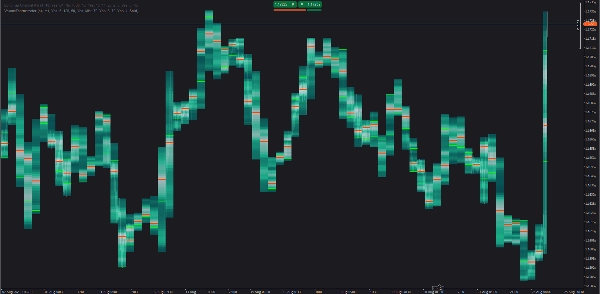
Một bản đồ nhiệt cTrader hiển thị cách khối lượng được phân bổ bên trong mỗi cây nến HTF. Nó sử dụng các thanh LTF (ví dụ, M1) để xây dựng các thùng khối lượng theo chiều dọc, sau đó vẽ POC và Giá trị Khu vực (VA). Cây nến HTF hiện tại (chưa hoàn thành) được vẽ theo thời gian thực.
Cách hoạt động
- Tổng hợp khối lượng tick từ các thanh LTF.
- Chia mỗi cây nến HTF thành
Binslát cắt giá và gán khối lượng theo sự chồng lấp giá. - Tô màu các thùng theo khối lượng tương đối; vẽ POC, các đường VA tùy chọn, và có thể kéo dài chúng sang bên phải.
- Tự động tải lịch sử cũ cho phạm vi hiển thị chỉ (lô nhỏ).
Sử dụng nó
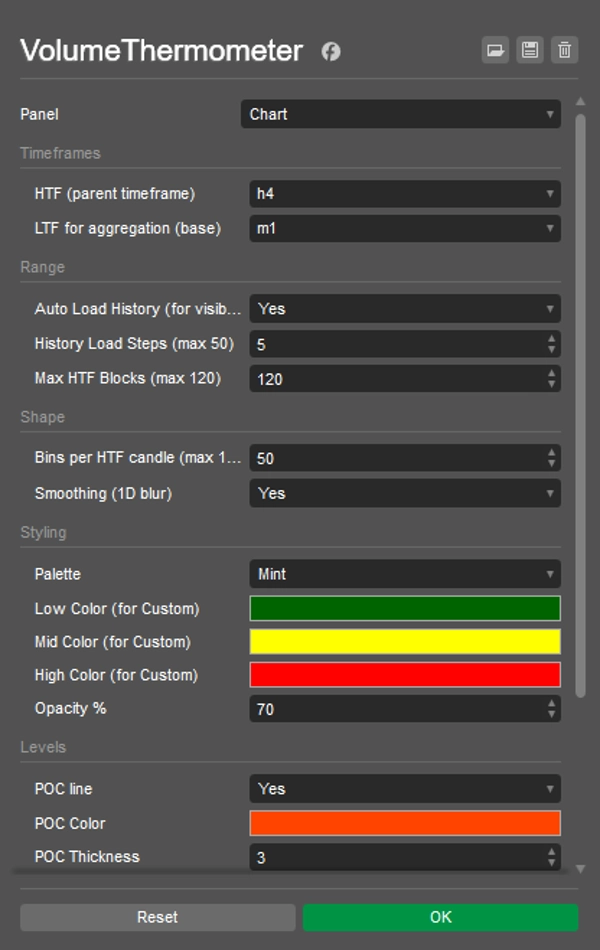
- Chọn HTF (ví dụ, H4) và LTF (ví dụ, M1).
- Bật Tự động tải lịch sử; cuộn/thu phóng đến phạm vi bạn muốn.
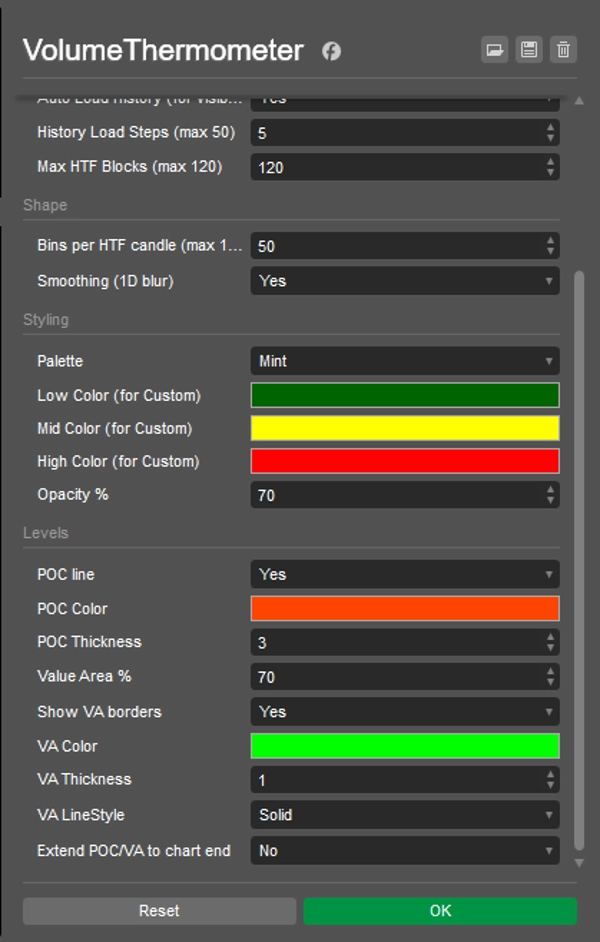
- Điều chỉnh Bins (chi tiết), Số khối HTF tối đa (bao nhiêu cây nến hiển thị), Làm mượt, Độ mờ, và màu sắc.
- Quan sát phản ứng POC/VA và cách POC di chuyển từ cây nến này sang cây nến khác.
Ý tưởng nhanh
- Kiểm tra lại POC: chạm đầu tiên của POC trước đó với xác nhận LTF.
- Xoay VA: tái nhập vào VA thường nhắm vào cạnh POC/cạnh VA khác.
- Đi qua LVN: các vùng mỏng (lạnh) có xu hướng di chuyển nhanh đến nút tiếp theo.
Ghi chú
- Sử dụng khối lượng tick (đại diện tốt trên FX/CFD, không phải khối lượng sàn giao dịch).
- Để tăng hiệu suất, giảm Bins hoặc Số khối HTF tối đa nếu cần.
Tóm tắt
Tóm tắt AI
VolumeThermometer is a cTrader indicator that visualizes intra-higher timeframe (HTF) volume distribution using a heatmap. It aggregates tick volume data from lower timeframe (LTF) bars (e.g., M1) to construct vertical volume bins within each HTF candle (e.g., H4). The indicator highlights the Point of Control (POC) and Value Area (VA) lines, showing where the most volume is concentrated by price level. The current HTF candle is updated in real time, and the indicator automatically loads historical data for the visible chart range in small batches to optimize performance.
Key features include:
- Aggregation of tick volume from LTF bars.
- Division of HTF candles into price bins with volume assigned by price overlap.
- Color-coded volume bins indicating relative volume intensity.
- Display of POC and optional VA lines, with the ability to extend these lines forward.
- Customizable settings for bin detail, maximum HTF candles displayed, smoothing, opacity, and colors.
- Supports multiple markets including Forex, indices, commodities, stocks, and cryptocurrencies such as BTCUSD and EURUSD.
Users can monitor POC retests, VA rotations, and low volume node pass-throughs to analyze volume behavior within HTF candles. The indicator uses tick volume as a proxy, suitable for FX and CFD markets.
Hồ sơ chỉ báo
Đánh giá của khách hàng
0.0
Đánh giá: 0
Đánh giá của khách hàng
Sản phẩm này chưa có đánh giá nào. Bạn đã dùng thử chưa? Hãy là người đầu tiên chia sẻ với mọi người!
Thảo luận
Câu hỏi thường gặp
BTCUSD
Prop
Forex
Indices
EURUSD
Commodities
Crypto
Stocks
NAS100
Các sản phẩm có sẵn trên cTrader Store, bao gồm bot giao dịch, chỉ báo và plugin, được cung cấp bởi các nhà phát triển bên thứ ba và chỉ nhằm mục đích cung cấp thông tin và tiếp cận kỹ thuật. cTrader Store không phải là nhà môi giới và không cung cấp lời khuyên đầu tư, khuyến nghị cá nhân hay bất kỳ đảm bảo nào về hiệu suất trong tương lai.


Giá
Kể từ 26/05/2025
386.5M
Khối lượng đã giao dịch
60.75K
Pip đạt được
14
Lượt bán
1.4K
Cài đặt miễn phí