
VolumeColorBar
Gösterge
10 satın almalar
Sürüm 1.2, Apr 2026
Windows, Mac
4.3
Değerlendirmeler: 3
Açıklama
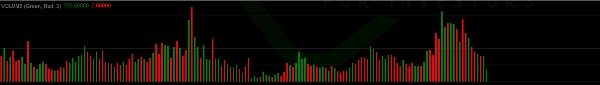
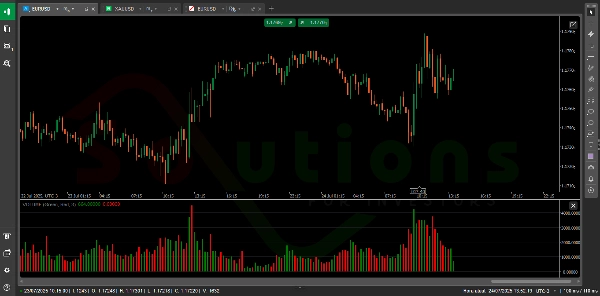
VolumeColorBar, mum yönüne göre renk kodlu çubuklar kullanarak piyasa hacmini görsel olarak temsil eden güçlü bir araçtır. Yeşil çubuklar yükseliş mumlarındaki hacmi (alış baskısı), kırmızı çubuklar ise düşüş mumlarındaki hacmi (satış baskısı) gösterir. Bu, yatırımcıların piyasa faaliyetinin alıcılar mı yoksa satıcılar mı tarafından daha çok yönlendirildiğini anında değerlendirmesine olanak tanır — bu da kopuşları doğrulamaya, dönüşleri tespit etmeye ve işlem zamanlamasını daha yüksek güvenle iyileştirmeye yardımcı olur.
Özet
YZ özeti
VolumeColorBar is a trading indicator that visualizes market volume using color-coded bars aligned with candle direction. It displays green bars for volume on bullish candles, indicating buying pressure, and red bars for volume on bearish candles, indicating selling pressure. This visual representation helps traders quickly assess whether market activity is dominated by buyers or sellers. The indicator supports various markets and symbols, including Forex pairs (EURUSD, GBPUSD, NZDUSD, USDJPY), cryptocurrencies (BTCUSD, crypto), commodities (XAUUSD, gold, oil, silver), indices (NAS100, SP500, DAX, Dow), and stocks. By providing immediate insight into volume dynamics relative to price movement, VolumeColorBar aids in confirming breakouts, identifying potential reversals, and improving trade timing decisions.
Gösterge profili
Müşteri değerlendirmeleri
4.3
Değerlendirmeler: 3
5 | 33 % | |
4 | 67 % | |
3 | 0 % | |
2 | 0 % | |
1 | 0 % |
Müşteri değerlendirmeleri
April 14, 2025
Clean tool for workflow for a more controlled workflow. It helps with planning entries around the first range, but false breaks still need filtering. I would track 20 market opens, the first 30 to 60 minutes and a target near 1.5R. I would still keep manual review in the process.
April 13, 2025
April 13, 2025
Worth a closer look around opening range breakouts. The useful part is planning entries around the first range, with the numbers checked before scaling. The setup should be tested across at least 15 sessions because 2 or 3 fakeouts can change the picture. The trade idea is clear, but it needs a hard stop and a defined breakout rule.
Tartışma
SSS
BTCUSD
Forex
Signal
Breakout
Indices
EURUSD
Commodities
GBPUSD
NZDUSD
Prop
Crypto
Stocks
XAUUSD
NAS100
USDJPY
cTrader Store üzerinden erişilebilen işlem botları, göstergeler ve eklentiler gibi ürünler, üçüncü taraf sağlayıcılar tarafından sağlanır ve yalnızca bilgilendirme ve teknik erişim amaçlarıyla sunulur. cTrader Store bir broker değildir ve yatırım tavsiyesi, kişisel öneriler vermez veya gelecekteki performansı garanti etmez.


Fiyat
Başlangıç 05/02/2025
31
Satışlar