
VegaXLR - RSI and StochRSI Alerts
Gösterge
15 satın almalar
Sürüm 1.0, Apr 2025
Windows, Mac
5.0
Değerlendirmeler: 3
Açıklama
VegaXLR - RSI ve StochRSI Uyarıları, RSI ve StochRSI olayları için uyarılar sağlayan bir cTrader göstergesidir ve yatırımcıları piyasa değişikliklerinden haberdar eder. Kullanıcıları aşırı alım/aşırı satım seviyeleri, merkez çizgisi kesişimleri ve K/D çizgisi kesişimleri hakkında bilgilendirir, tümü özelleştirilebilir ayarlarla.
Temel Özellikler:
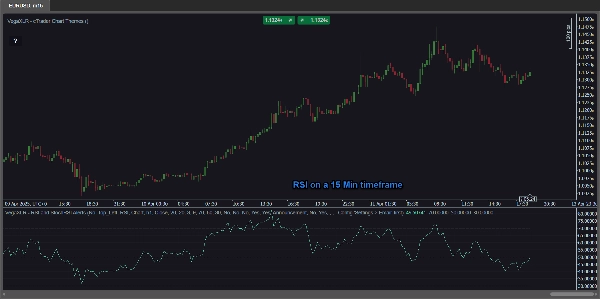
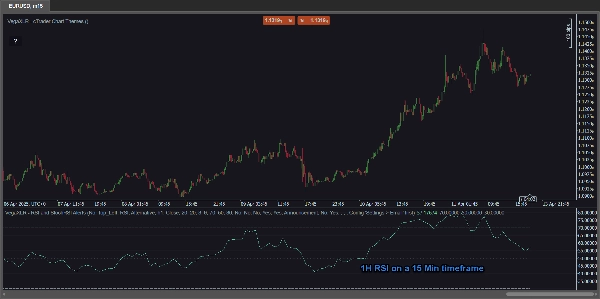
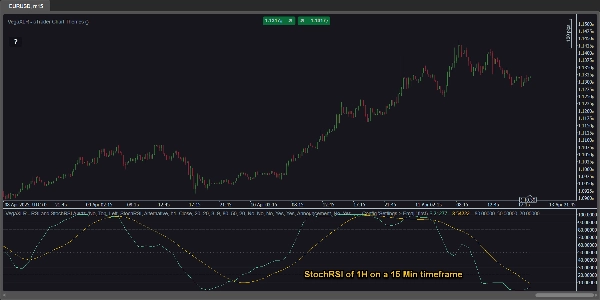
- Çoklu Zaman Dilimi Analizi: RSI ve StochRSI değerlerini mevcut grafiğinizde doğrudan herhangi bir zaman diliminden benzersiz şekilde görüntüleyin. Örneğin, grafik zaman diliminizi değiştirmeden 15 dakikalık grafik görüntülerken 1 saatlik RSI'yı analiz edin!
- RSI & StochRSI Uyarıları: Aşağıdaki durumlar için bildirim alın:
-
- Aşırı alım ve aşırı satım koşulları
- Merkez çizgisi kesişimleri (yüzde 50)
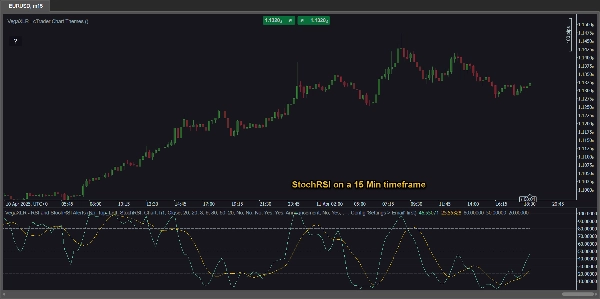
- K ve D çizgisi kesişimleri (StochRSI)
- Özelleştirilebilir Ayarlar: RSI kaynağı, periyotlar, K/D değerleri ve uyarı eşiklerini hassas kontrol için ayarlayın.
- Çok Yönlü Uyarılar: Şunlardan seçin:
-
- cTrader açılır pencereleri
- Sesli uyarılar
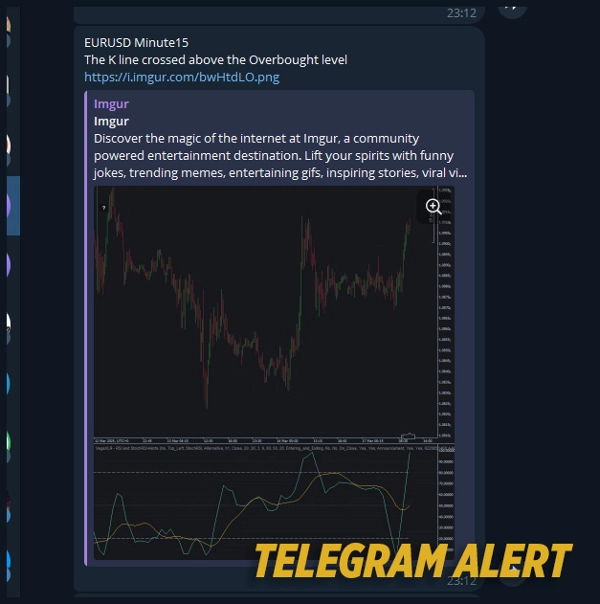
- Telegram uyarıları (isteğe bağlı grafik ekran görüntüleri ile)
- E-posta bildirimleri
- Entegre RSI & StochRSI Çizgileri: Ek göstergelere gerek yok—hepsi içinde!
Anında Erişim Kılavuzu: Kullanıcı kılavuzunu açan kullanışlı bir grafik içi buton.
Özet
YZ özeti
VegaXLR - RSI and StochRSI Alerts is a cTrader indicator designed to monitor and notify traders of key RSI and StochRSI events. It provides alerts for overbought and oversold conditions, centerline (50%) crossovers, and K/D line crossovers within the StochRSI. The indicator supports multi-timeframe analysis, allowing users to view RSI and StochRSI values from any timeframe directly on their current chart without switching timeframes. Customizable settings enable adjustment of RSI source, periods, K/D values, and alert thresholds for tailored monitoring. Alert delivery options include cTrader popups, sound alerts, Telegram notifications (with optional chart screenshots), and email messages. The indicator integrates RSI and StochRSI lines internally, eliminating the need for additional indicators. An in-chart button provides instant access to the user manual for guidance. This tool assists traders in identifying precise market shifts and potential trade entry points based on momentum indicators.
Gösterge profili
Müşteri değerlendirmeleri
5.0
Değerlendirmeler: 3
5 | 100 % | |
4 | 0 % | |
3 | 0 % | |
2 | 0 % | |
1 | 0 % |
Müşteri değerlendirmeleri
April 27, 2025
Steady choice for testing for traders who use momentum confirmation. It gives value around oscillator setups, but strong trends can keep signals stretched. A clean test needs 25 oscillator signals, 2 timeframe confirmation and a clear 1R exit plan. The tool is useful when overbought or oversold is treated as context, not a command.
April 26, 2025
April 26, 2025
Good enough to inspect for oscillator setups. it gives a familiar read on overextension and momentum, especially when used for checking stretched conditions before entries. RSI style levels around 30 and 70 help, but I would add a 2 swing divergence check. The tool is useful when overbought or oversold is treated as context, not a command.
Tartışma
SSS
RSI
cTrader Store üzerinden erişilebilen işlem botları, göstergeler ve eklentiler gibi ürünler, üçüncü taraf sağlayıcılar tarafından sağlanır ve yalnızca bilgilendirme ve teknik erişim amaçlarıyla sunulur. cTrader Store bir broker değildir ve yatırım tavsiyesi, kişisel öneriler vermez veya gelecekteki performansı garanti etmez.


!["[Stellar Strategies] Market Session Ultimate" logosu](https://cdn.ctrader.com/image/webp/61ffd537-0125-4246-9e72-42eca1791d64_28232)


Fiyat
215
Satışlar
677
Ücretsiz yüklemeler