
Açıklama
Ultimate cTrader Grafik Formasyonu Göstergesi ile Ticaretinizi Devrimleştirin
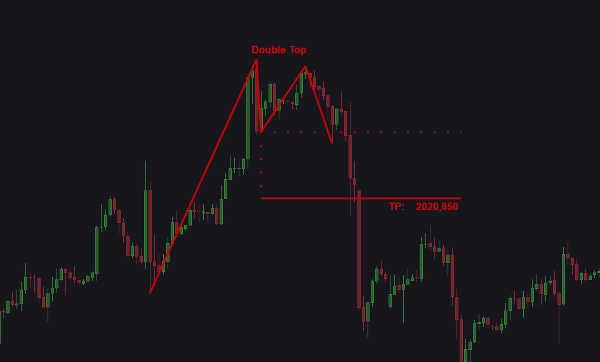
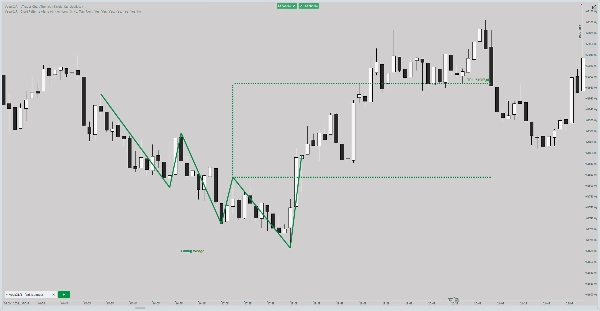
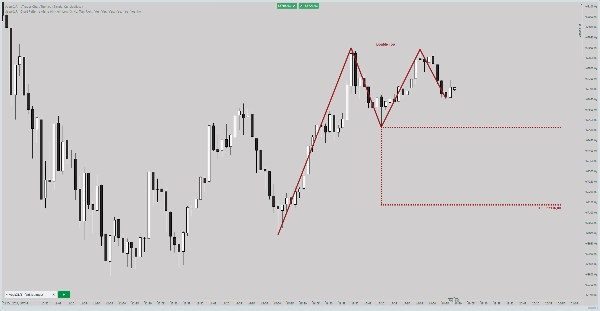
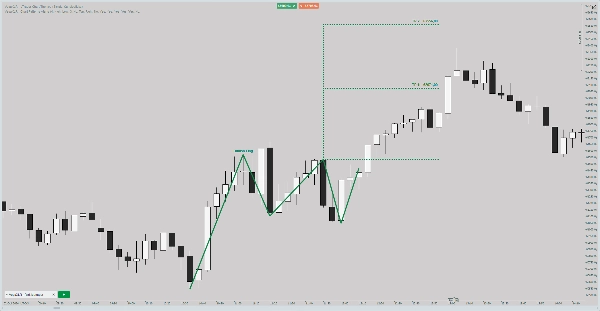
Ticaret stratejinizi bu son teknoloji cTrader göstergesi ile bir üst seviyeye taşıyın, kritik grafik formasyonlarını tespit etmek ve vurgulamak için uzmanlıkla tasarlanmıştır. Bu gelişmiş araç, Çift Tepeler, Baş ve Omuzlar, Yükselen Üçgenler gibi önemli formasyonları tanır ve daha fazlasını sunar, forex , hisse senedi piyasası ticareti ve cTrader platformundaki tüm piyasalarda işlem yapanlara güçlü bir avantaj sağlar.
Ana Özellikler:
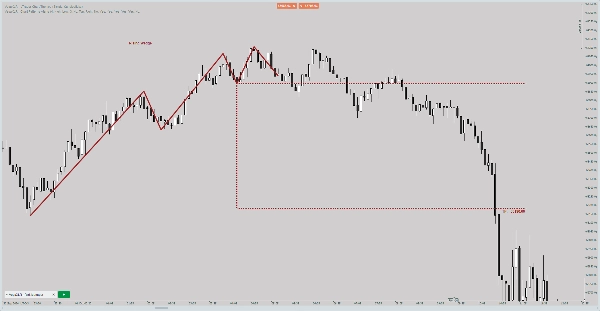
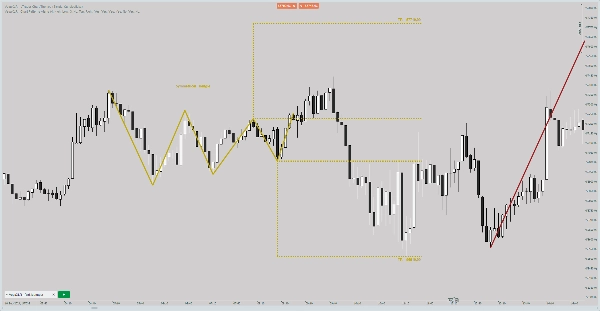
- Otomatik Grafik Formasyonu Tespiti: Boğa Bayrakları, Simetrik Üçgenler ve Yükselen Kama gibi formasyonları anında tespit edin.
- Formasyon Salınımı Çizimi: Boyun çizgilerini, hedef çizgilerini ve fiyat hareketlerini kolayca görselleştirin.
- Özelleştirilebilir Uyarılar: Ses, açılır pencere, Telegram veya E-posta yoluyla ihtiyaçlarınıza göre uyarlanmış uyarılarla haberdar olun.
- Renk Kodlu İçgörüler: Özelleştirilebilir renk şemaları kullanarak boğa, ayı ve nötr formasyonları hızlıca ayırt edin.
- İstatistikli Formasyon Listesi: Kısaltmalar ve sayımları gösteren entegre liste ile formasyon oluşumlarını kolayca takip edin.
- Ayarlanabilir Yakınlaştırma Seviyeleri: Detaylı analiz için belirli formasyon boyutlarına odaklanın.
- Kâr Potansiyeli Gösterimi: Açık kâr büyüklüğü göstergeleri ile potansiyel ticaret fırsatlarını değerlendirin.
- Zaman Dilimi ve Sembol Netliği: Uyarılar, bilinçli kararlar için sembol ve zaman dilimi hakkında kesin bilgiler içerir.
- Uyarıları Duraklatma Seçeneği: Bildirimleri duraklatarak dikkat dağınıklığı olmadan formasyonları analiz edin.
- Kullanıcı Notları Özelliği: Strateji geliştirme veya formasyona özel notlar için yorum ekleyin.
Tespit Edilen Grafik Formasyonları:
- Çift Tepe
- Çift Dip
- Baş ve Omuzlar
- Ters Baş ve Omuzlar
- Simetrik Üçgen
- Yükselen Üçgen
- Alçalan Üçgen
- Boğa Bayrağı
- Ayı Bayrağı
- Yükselen Kama
- Alçalan Kama
Bu sezgisel ticaret göstergesi, otomatik grafik formasyonu tespiti, özelleştirilebilir uyarılar ve gerçek zamanlı görselleştirmeleri birleştirerek tüccarlara güç verir. İster forex piyasasında işlem yapıyor olun, ister hisse senedi grafiklerini analiz ediyor olun ya da cTrader özel göstergelerini keşfediyor olun, bu araç daha akıllı ve daha emin kararlar vermeniz için gereken içgörüleri sağlar. Teknik analizde ustalaşmak ve risk yönetimi stratejilerini optimize etmek isteyen tüccarlar için mükemmeldir.
Bugün bu kapsamlı cTrader göstergesi ile ticaret potansiyelinizi açığa çıkarın!
Uyarı:
Bu gösterge, grafik formasyonları ve piyasa verilerine dayalı içgörüler ve görselleştirmeler sağlayarak tüccarlara yardımcı olmak için tasarlanmış bir teknik analiz aracıdır. Bağımsız bir ticaret çözümü olarak işlev görmez ve kârlı sonuçlar garanti etmez. Kullanıcılar, bu ürünü kullanırken kendi ticaret stratejilerini, risk yönetimini ve karar alma süreçlerini uygulamalıdır. Geçmiş performans gelecekteki sonuçların göstergesi değildir. Finansal piyasalarda işlem yapmak önemli riskler içerir ve yalnızca kaybetmeyi göze alabileceğiniz sermaye ile işlem yapmalısınız.
Özet
Key functionalities include automatic pattern detection, real-time visualization of pattern components like necklines and target lines, and customizable alerts delivered via sound, pop-up, Telegram, or email. It features color-coded insights to distinguish bullish, bearish, and neutral patterns, a pattern list with occurrence statistics, adjustable zoom levels for detailed analysis, and profit potential display to evaluate trade opportunities. Alerts provide clear symbol and timeframe information, and users can pause notifications or add personal notes for strategy refinement.
This tool assists traders in technical analysis and risk management by providing actionable insights based on chart patterns. It is intended as a supportive tool and does not function as a standalone trading solution. Users must apply their own trading strategies and risk controls when using this indicator.
Müşteri değerlendirmeleri
5 | 67 % | |
4 | 0 % | |
3 | 33 % | |
2 | 0 % | |
1 | 0 % |


