Mô tả
BB20 Đa màu
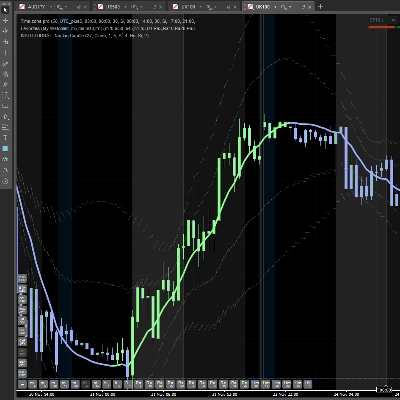
Một chỉ báo nhận diện chu kỳ thị trường mạnh mẽ được phủ trực tiếp lên biểu đồ của bạn, mã hóa màu sắc hành động giá qua 8 trạng thái thị trường khác nhau — từ giảm sâu đến tăng hoàn toàn — sử dụng mối quan hệ giữa giá và bốn đường trung bình động chính (MM20, MM50, MM100, MM200) kết hợp với Dải Bollinger.
──────────────────────────
CÁCH HOẠT ĐỘNG
──────────────────────────
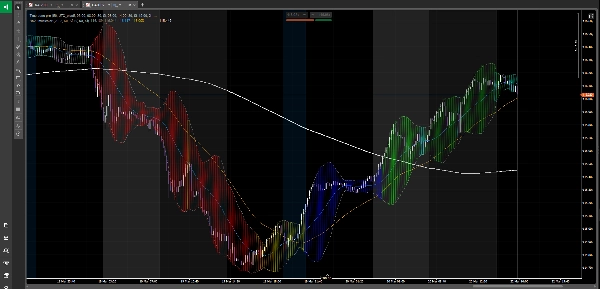
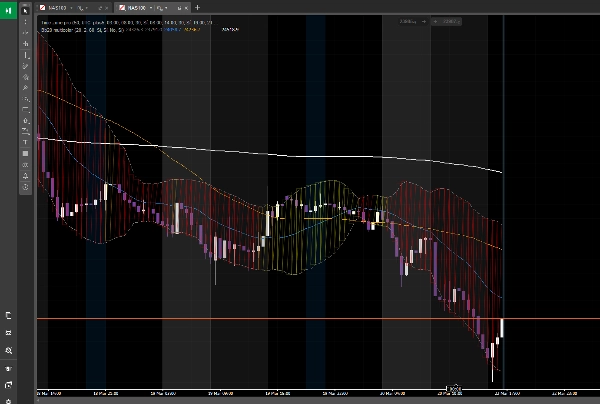
Chỉ báo liên tục đánh giá vị trí của giá so với bốn đường trung bình động và gán một trong 8 màu cho vùng mây Dải Bollinger, giúp bạn có cái nhìn trực quan ngay lập tức về giai đoạn chu kỳ thị trường hiện tại:
🔴 ĐỎ — Xu hướng giảm rõ ràng
Giá nằm dưới MM200. Thị trường bị chi phối bởi người bán. Xu hướng: chỉ bán khống.
🟠 CAM — Tăng kỹ thuật
Giá nằm dưới MM200 nhưng đã hồi phục trên MM20. Một đợt bật lên trong xu hướng giảm — không phải là sự đảo chiều. Vùng bẫy bò phổ biến.
🟡 VÀNG — Giai đoạn chu kỳ 1
Giá đã vượt lên trên MM50 nhưng các đường trung bình động vẫn đang giảm. Dấu hiệu đầu tiên của sự phục hồi, chưa được xác nhận.
🔵 XANH DƯƠNG — Cố gắng đảo chiều xu hướng
MM100 và MM50 nằm dưới MM200, nhưng giá bắt đầu leo lên giữa chúng. Vùng chuyển đổi biến động cao — theo dõi kỹ.
⬜ XÁM — Trung lập / suy yếu
Giá nằm trên MM200 nhưng dưới MM100. Cấu trúc dài hạn vẫn tăng nhưng động lực đang giảm dần. Vùng cảnh báo.
🟢 XANH CHANH — Giai đoạn chu kỳ 2
Giá và MM50 nằm trên MM200. Một chu kỳ tăng mới đang được xác nhận. Nhiều nhà giao dịch tổ chức bắt đầu định vị tại đây.
🪵 XANH LÁ MẠT — Tích lũy lành mạnh
Giá nằm trên MM200 và MM100 nhưng đang kéo lui về phía MM50 hoặc MM20. Một sự tạm dừng bình thường trong xu hướng tăng — vùng có thể vào lại.
🌲 XANH LÂU NĂM — Chu kỳ tăng trưởng trưởng thành
Tất cả các đường trung bình động hoàn toàn thẳng hàng: MM200 < MM50 < MM20 < Giá. Môi trường xu hướng sạch nhất. Kháng cự tối thiểu về phía trên.
──────────────────────────
TÍNH NĂNG
──────────────────────────
• Các vùng mây được vẽ trực tiếp bằng Chart.DrawTriangle của cTrader cho các vùng tô mượt mà, chuyên nghiệp
• Dải Bollinger (trên và dưới) hiển thị cùng với vùng mây
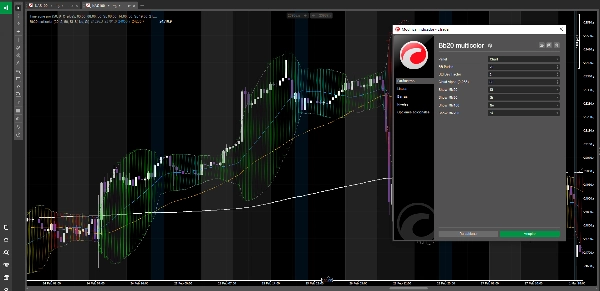
• Bốn đường trung bình động đều có thể bật/tắt riêng biệt (MM20, MM50, MM100, MM200)
• Cấu hình được chu kỳ BB, hệ số độ lệch chuẩn và độ trong suốt của vùng mây
• Hoạt động trên mọi công cụ và mọi khung thời gian
• Hoàn toàn mã nguồn mở — miễn phí mãi mãi
──────────────────────────
CÁCH SỬ DỤNG
──────────────────────────
1. Sử dụng màu sắc như bộ lọc bối cảnh thị trường trước khi thực hiện giao dịch
2. Chỉ tìm lệnh mua khi nền màu xanh (chanh hoặc xanh lâu năm)
3. Chỉ tìm lệnh bán khi nền màu đỏ hoặc cam
4. Sử dụng màu vàng, xanh dương và xám như vùng chuyển tiếp — giảm kích thước hoặc chờ xác nhận
5. Màu xanh lá mạ là vùng vào lại trong xu hướng tăng đã thiết lập
Tương thích với mọi chiến lược giao dịch. Đặc biệt hiệu quả khi kết hợp với hành động giá, phân tích khối lượng hoặc các phương pháp dựa trên tâm lý thị trường.
Cài đặt nó, thả lên biểu đồ của bạn, và ngay lập tức biết được giai đoạn thị trường đang ở.
⚠️ CẢNH BÁO RỦI RO
Giao dịch các công cụ tài chính có rủi ro và không phù hợp với tất cả mọi người. Luôn tự phân tích, quản lý rủi ro cẩn thận và không bao giờ giao dịch bằng số tiền bạn không thể mất.
Chỉ báo này là công cụ phân tích kỹ thuật — không phải lời khuyên tài chính. Hãy sử dụng một cách khôn ngoan.
Tóm tắt
- Red: Clear bearish trend (price below MM200)
- Orange: Technical bounce within bearish trend
- Yellow: Early recovery signs (price above MM50, but MAs bearish)
- Blue: Trend reversal attempt with high volatility
- Gray: Neutral or weakening momentum (price above MM200 but below MM100)
- Lime Green: Confirmed new bullish cycle (price and MM50 above MM200)
- Teal: Healthy consolidation in bullish trend (price above MM200 and MM100, pulling back)
- Dark Green: Mature bullish cycle with aligned moving averages
Features include native cloud rendering using cTrader's Chart.DrawTriangle, toggleable moving averages, configurable Bollinger Bands parameters, and compatibility with any instrument and timeframe. The indicator is open source and free to use. It serves as a market context filter to guide trade decisions, recommending long positions in green zones and shorts in red/orange zones, with caution advised in transition colors. It complements various trading strategies, including price action and volume analysis.