
Mô tả
VOLUME HEATMAP PRO - Hiển thị mật độ thị trường chuyên nghiệp
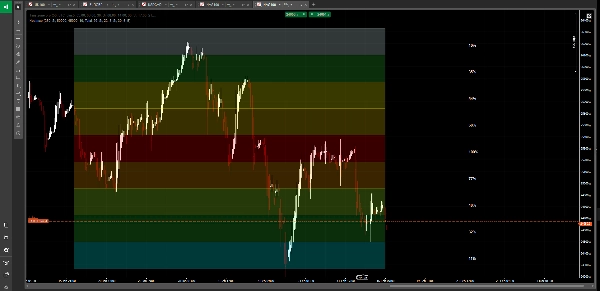
Xem thị trường như chưa từng có trước đây với bản đồ nhiệt khối lượng tiên tiến này, biến dữ liệu khối lượng phức tạp thành một hiển thị trực quan dễ hiểu. Khác với các chỉ báo khối lượng truyền thống chỉ hiển thị thanh ở dưới cùng biểu đồ của bạn, Volume Heatmap Pro tiết lộ chính xác nơi các nhà giao dịch tổ chức đang tích lũy và phân phối vị thế trên mọi mức giá.
TÍNH NĂNG CHÍNH:
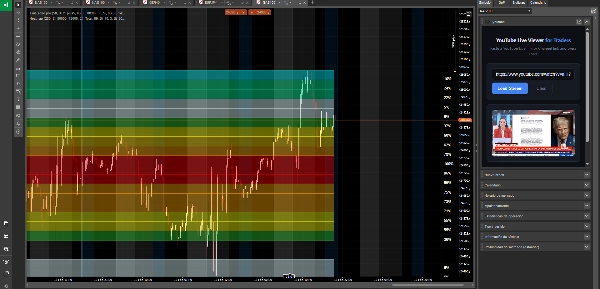
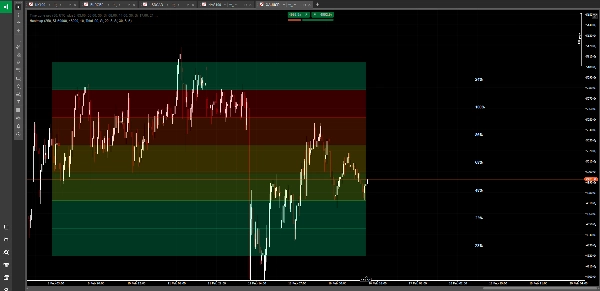
🔥 Bản đồ nhiệt mã màu động
Trải nghiệm phân tích khối lượng qua hệ thống gradient màu 10 cấp độ tuyệt đẹp. Từ xanh lam băng giá (hoạt động tối thiểu) đến đỏ rực (khối lượng tối đa), ngay lập tức nhận biết nơi dòng tiền lớn đang chảy. Bản đồ nhiệt cập nhật theo thời gian thực, cho bạn thấy mật độ thị trường chỉ trong nháy mắt.
📍 Phát hiện Điểm Kiểm Soát (POC)
Tự động xác định và làm nổi bật mức giá có khối lượng giao dịch cao nhất - điểm cân bằng thực sự của thị trường. Đây là nơi các tổ chức đã xây dựng vị thế lớn nhất và nơi giá có xu hướng quay trở lại.
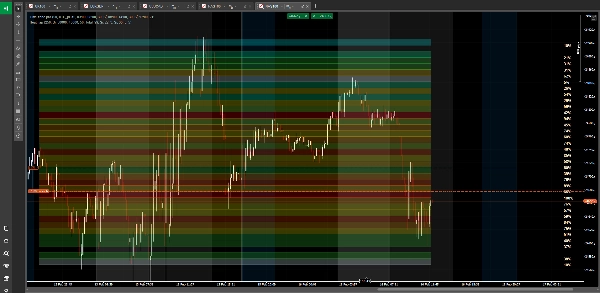
🎯 Phân phối khối lượng đa cấp
Chia phạm vi giá của bạn thành tối đa 50 cấp độ chính xác, tạo bản đồ chi tiết về phân phối khối lượng. Xem chính xác mức giá nào thu hút giao dịch mạnh và mức giá nào bị thị trường bỏ qua.
📊 Ba chế độ phân tích khối lượng
• Tổng khối lượng - Xem tất cả hoạt động thị trường
• Chỉ khối lượng mua - Tách biệt các vùng áp lực tăng giá
• Chỉ khối lượng bán - Xác định các khu vực phân phối giảm giá
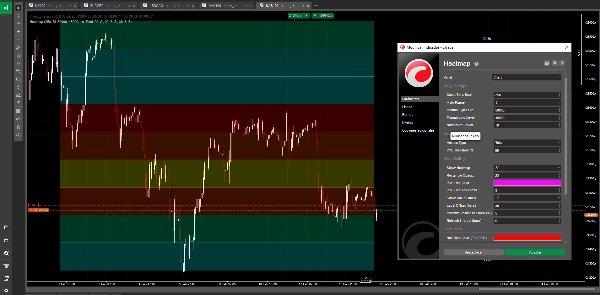
🎨 Hiển thị chuyên nghiệp
• Hình chữ nhật mã màu trải dài trong khoảng thời gian phân tích của bạn
• Độ mờ điều chỉnh được để tích hợp hoàn hảo với biểu đồ
• Nhãn phần trăm khối lượng tùy chọn trên mỗi cấp độ
• Đường POC tùy chỉnh với điều khiển độ dày
• Hiển thị sạch sẽ, không gây cản trở
⚙️ Công nghệ tự động điều chỉnh phạm vi thông minh
Tự động tính toán phạm vi giá tối ưu từ khoảng thời gian xem lại của bạn, hoặc tự định nghĩa phạm vi riêng cho phân tích cụ thể. Bản đồ nhiệt thích ứng với mọi điều kiện thị trường hoặc khung thời gian.
🔄 Tối ưu hiệu suất
Khoảng thời gian làm mới có thể cấu hình đảm bảo hiệu suất biểu đồ mượt mà trong khi duy trì phân tích khối lượng chính xác. Phân tích lên đến 500 thanh trước đó mà không bị giật lag.
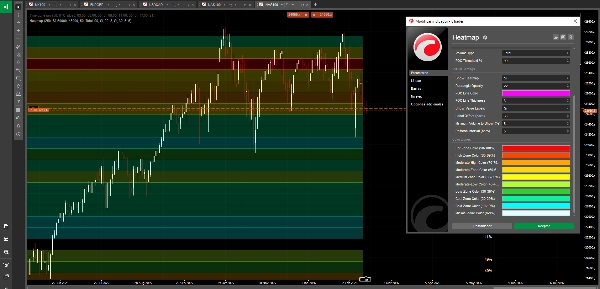
📈 Vùng màu tùy chỉnh
Cá nhân hóa tất cả 10 vùng màu để phù hợp với sở thích thị giác của bạn:
• Vùng nóng (90-100%) - Tập trung khối lượng tối đa
• Vùng cao (80-89%) - Hoạt động mạnh
• Trung bình-cao (70-79%) - Khối lượng trên mức trung bình
• Trung bình (60-69%) - Hoạt động vững chắc
• Trung bình (50-59%) - Khối lượng trung bình
• Trung bình-thấp (40-49%) - Dưới mức trung bình
• Vùng thấp (30-39%) - Hoạt động nhẹ
• Vùng mát (20-29%) - Giao dịch tối thiểu
• Vùng lạnh (10-19%) - Khối lượng rất nhẹ
• Tối thiểu (0-9%) - Gần như không có hoạt động
PHÙ HỢP CHO:
• Xác định các vùng tích lũy và phân phối của tổ chức
• Tìm các nút khối lượng thấp cho các khu vực có khả năng bứt phá
• Phát hiện các mức hỗ trợ và kháng cự khối lượng cao
• Hiểu cấu trúc thị trường và thanh khoản
• Xác nhận điểm vào lệnh tại các khu vực khối lượng cao
• Tránh các vùng bẫy thanh khoản thấp
• Phân tích hồ sơ khối lượng đa khung thời gian
ĐIỀU GÌ LÀM NÓ KHÁC BIỆT:
Các chỉ báo khối lượng truyền thống cho bạn biết bao nhiêu đã được giao dịch, nhưng không phải ở đâu. Volume Heatmap Pro tiết lộ bức tranh toàn cảnh - một bản đồ mật độ trực quan cho thấy chính xác các mức giá nào hấp thụ nhiều hoạt động giao dịch nhất. Hệ thống màu gradient làm cho việc phân tích khối lượng phức tạp trở nên đơn giản như đọc bản đồ thời tiết. Màu đỏ nghĩa là nóng (khối lượng lớn), màu xanh nghĩa là lạnh (khối lượng nhẹ).
Dù bạn đang lướt sóng đảo chiều trong ngày hay định vị cho giao dịch swing, bản đồ nhiệt này cho bạn thấy nơi thị trường có sự thuyết phục thực sự so với nơi chỉ là tiếng ồn.
---
⚠️ CẢNH BÁO RỦI RO:
Giao dịch ngoại hối, tiền điện tử và các công cụ tài chính khác mang mức độ rủi ro cao và có thể không phù hợp với tất cả nhà đầu tư. Mức đòn bẩy cao có thể gây bất lợi cũng như có lợi cho bạn. Trước khi quyết định giao dịch, bạn nên cân nhắc kỹ các mục tiêu đầu tư, mức độ kinh nghiệm và khả năng chịu rủi ro của mình. Có khả năng bạn sẽ chịu mất một phần hoặc toàn bộ khoản đầu tư. Do đó, bạn không nên đầu tư số tiền mà bạn không thể chịu mất. Bạn nên nhận thức đầy đủ về tất cả các rủi ro liên quan đến giao dịch và tìm lời khuyên từ cố vấn tài chính độc lập nếu có bất kỳ nghi ngờ nào. Hiệu suất trong quá khứ không đảm bảo kết quả trong tương lai.
Tóm tắt
Key features include automatic Point of Control (POC) detection, highlighting the price level with the highest trading volume, and multi-level volume distribution dividing the price range into up to 50 levels for detailed analysis. It supports three volume modes: total volume, buy volume only, and sell volume only, enabling users to isolate bullish or bearish pressure zones.
The indicator offers professional visualization with adjustable opacity, customizable color zones, optional volume percentage labels, and a customizable POC line. Smart auto-range technology calculates optimal price ranges based on the lookback period or manual input. Performance is optimized for smooth updates and analysis of up to 500 bars without lag.
Heatmap is suitable for identifying institutional accumulation and distribution zones, spotting support and resistance levels, understanding market structure, and conducting multi-timeframe volume profile analysis across markets including Forex, indices, and XAUUSD (gold).
Đánh giá của khách hàng
5 | 67 % | |
4 | 33 % | |
3 | 0 % | |
2 | 0 % | |
1 | 0 % |


