
Mô tả
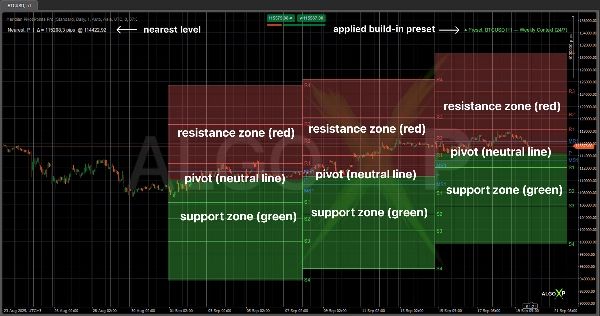
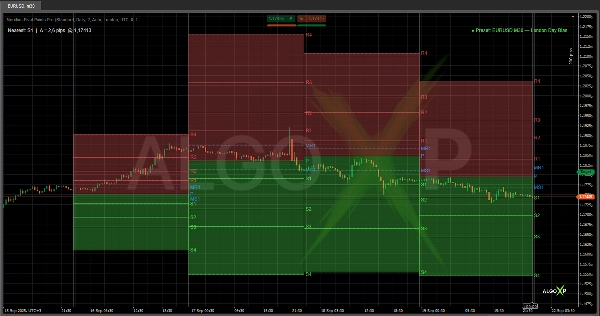
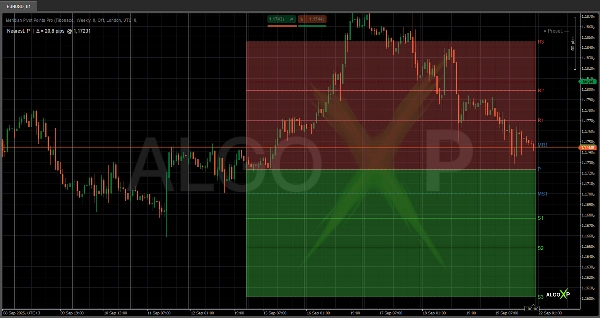
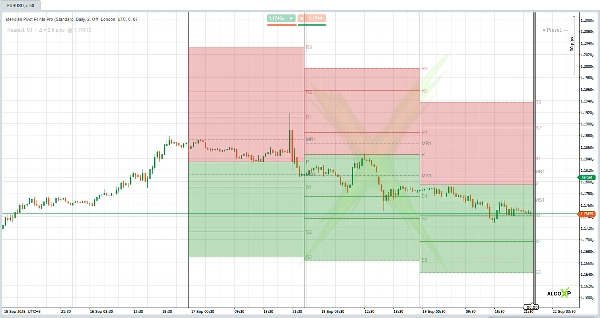
🚀 Meridian Pivot Points Pro là một chỉ báo pivot cao cấp cho cTrader thích ứng với phiên giao dịch và khung thời gian. Nó vẽ các mức pivot chuyên nghiệp (P, R1–R5, S1–S5) cho các công thức Chuẩn, Fibonacci, Woodie, Camarilla và DeMark, thêm mức trung gian, và làm nổi bật vùng (xanh lá dưới P, đỏ trên P) với độ trong suốt có thể điều chỉnh.
Các Cài đặt Tự động tích hợp điều chỉnh ngay lập tức các thiết lập cho các ký hiệu và khung thời gian phổ biến. HUD hiển thị mức gần nhất (với khoảng cách tính bằng pip) và tên cài đặt đang hoạt động khi khớp. Các cảnh báo thông minh thông báo khi mức băng qua hoặc gần kề — với điều khiển âm thanh độc lập.
Hoạt động ngay khi sử dụng cho Forex, chỉ số, vàng, dầu và tiền điện tử trên cả giao dịch trong ngày và giao dịch swing.
Khám phá thêm tài nguyên và phần Hỏi đáp chi tiết tại AlgoXP
🔥 Tại sao các nhà giao dịch chọn Meridian
- Nhận biết phiên: sử dụng pivot hàng ngày/tuần/tháng hoặc chế độ Phiên với các cài đặt sẵn có sẵn (Tokyo, London, New York, Overlap, v.v.) và bù giờ UTC/Broker/Tùy chỉnh.
- Cài đặt Tự động (mới): khi bật, chỉ báo tự động áp dụng một thiết lập được tuyển chọn cho các kết hợp ký hiệu + khung thời gian đã biết và hiển thị tên cài đặt trong HUD.
- Rõ ràng theo thiết kế: các mức trung gian, nhãn, chủ đề sạch sẽ và các dải bán trong suốt (hỗ trợ màu xanh lá, đỏ cho kháng cự, xanh dương cho pivot).
- Cảnh báo có thể hành động: băng qua khi đóng nến và gần kề tính bằng pip, mỗi loại có nút bật/tắt âm thanh riêng.
- Nhẹ và dễ đọc: tối ưu để vẽ các khoảng thời gian hiện tại và (tuỳ chọn) lịch sử với kiểu chữ sắc nét.
🧭 Cách sử dụng
- Xu hướng: Trên P = xu hướng tăng; dưới P = xu hướng giảm.
- Làm việc với các vùng: Ở vùng xanh lá, tìm cách mua hướng về P → R1; ở vùng đỏ, tìm cách bán hướng về P → S1.
- Mức trung gian: MR1/MS1 là các điểm hồi lại/kiểm tra lại sạch sẽ bên trong P–R1 và S1–P.
- Phá vỡ & đóng cửa: Đóng cửa trên R1 → mục tiêu R2 (sau đó là R3…); đóng cửa dưới S1 → mục tiêu S2 (sau đó là S3…).
- Chế độ phiên: Giao dịch trong cửa sổ hoạt động của bạn (ví dụ, London hoặc giao thoa London–NY) để có các lần chạm và theo dõi rõ ràng hơn.
🤖 Cài đặt sẵn tích hợp
EURUSD M30, GBPUSD M15, USDJPY M5, XAUUSD M15, XAUUSD H1, US100 M5, USOIL M15, DAX40 M5, BTCUSD H1, ETHUSD H1, EURUSD H1, GBPJPY M15.
Tóm tắt
Key features include session modes with presets for major trading sessions (Tokyo, London, New York, and overlaps), automatic presets that optimize settings for popular symbols and timeframes, and a heads-up display (HUD) showing the nearest pivot level and active preset. Smart alerts notify users on pivot level crosses or proximity, each with independent sound controls.
Meridian Pivot Points Pro supports multiple markets such as Forex, indices, gold, oil, and cryptocurrencies, suitable for intraday and swing trading. It emphasizes clarity with clean labels, semi-transparent bands, and optimized drawing for current and historical periods. Built-in presets cover common symbol and timeframe combinations like EURUSD M30, GBPUSD M15, XAUUSD H1, BTCUSD H1, and others, facilitating quick setup and use.
Đánh giá của khách hàng
5 | 100 % | |
4 | 0 % | |
3 | 0 % | |
2 | 0 % | |
1 | 0 % |


