
Mô tả
EMAScalpHistogram: Trực quan hóa Đà để Quản lý Giao dịch
EMAScalpHistogram là gì?
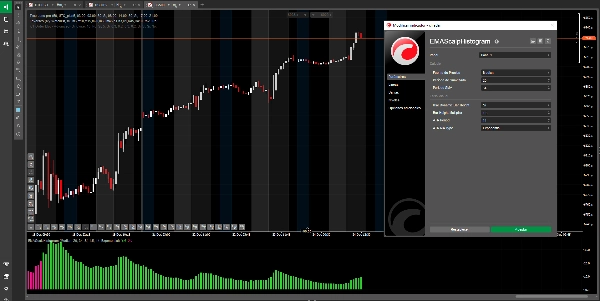
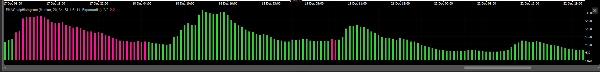
EMAScalpHistogram là một công cụ phân tích kỹ thuật tiên tiến biến sự phức tạp của đà thị trường thành một biểu đồ trực quan và dễ hiểu. Thiết kế của nó cho phép nhận biết sức mạnh và hướng của xu hướng chỉ trong một cái nhìn.
- Thanh màu xanh lá (Tăng giá): Chỉ ra đà mua mạnh, gợi ý rằng người mua đang kiểm soát thị trường.
- Thanh màu hồng (Giảm giá): Chỉ ra đà bán mạnh, gợi ý rằng người bán đang chi phối hành động giá.
- Chiều cao động: Chiều cao của các thanh không cố định; nó thích ứng với biến động thị trường. Các thanh cao hơn báo hiệu các chuyển động mạnh mẽ và quyết đoán hơn, trong khi các thanh thấp hơn cho thấy sự tạm dừng hoặc xu hướng yếu đi.
Mục đích chính và Chiến lược được khuyến nghị
EMAScalpHistogram là một công cụ quản lý giao dịch cao cấp, được thiết kế cho các nhà giao dịch muốn tối đa hóa lợi nhuận bằng cách giữ vị thế với sự tự tin cao hơn. Giá trị lớn nhất của nó là giúp bạn duy trì và khuếch đại lợi nhuận khi bạn đã vào lệnh.
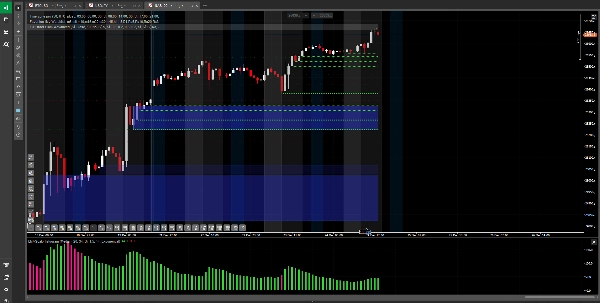
- Xác nhận xu hướng: Chức năng mạnh mẽ nhất của nó là xác thực sức mạnh của một xu hướng bạn đã xác định. Nếu bạn đang giữ vị thế mua và biểu đồ liên tục hiển thị các thanh màu xanh lá, đó là sự xác nhận trực quan rằng đà mua vẫn còn nguyên vẹn.
- Quản lý giao dịch (Giữ và Khuếch đại lợi nhuận):
-
- Giữ vị thế: Đây là ứng dụng có giá trị nhất của nó. Sử dụng nó để quyết định khi nào nên giữ vị thế với sự tự tin. Nếu biểu đồ tiếp tục hiển thị các thanh có lợi cho bạn, nó giúp bạn có kỷ luật không đóng giao dịch có lợi quá sớm do những biến động nhỏ của thị trường.
- Khuếch đại lợi nhuận: Bằng cách giúp bạn giữ vị thế trong suốt giai đoạn đà mạnh, nó cho phép bạn nắm bắt các chuyển động lớn hơn và tăng tiềm năng lợi nhuận.
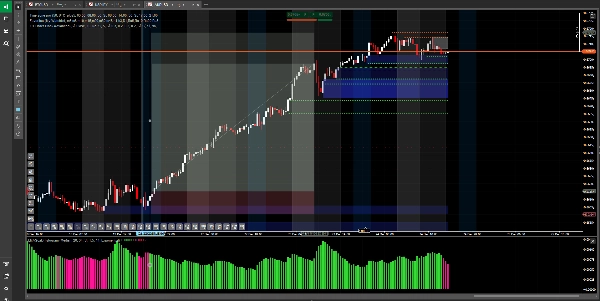
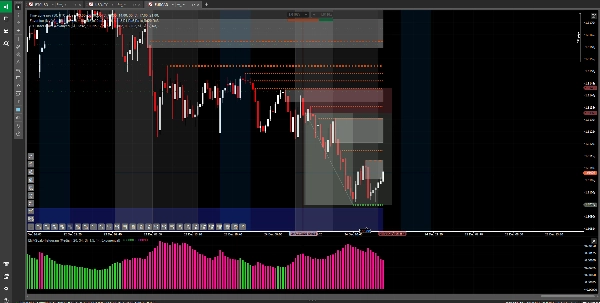
- Cảnh báo đà yếu đi: Sự thay đổi màu sắc của biểu đồ (từ xanh lá sang hồng hoặc ngược lại) là một trong những cảnh báo đầu tiên cho thấy đà đang cạn kiệt, gợi ý rằng có thể là thời điểm tốt để bảo vệ lợi nhuận hoặc điều chỉnh chiến lược thoát lệnh.
Những điều cần tránh
Không phải tín hiệu vào lệnh: Quan trọng là, EMAScalpHistogram không được thiết kế để sử dụng như một tín hiệu độc lập để mở các giao dịch mới. Là một chỉ báo xác nhận sức mạnh của một chuyển động đang diễn ra, sử dụng nó để vào lệnh có thể dẫn đến các giao dịch muộn với rủi ro cao và tiềm năng lợi nhuận hạn chế.
Cảnh báo rủi ro và Tuyên bố từ chối trách nhiệm
Việc sử dụng chỉ báo này là theo rủi ro và trách nhiệm của bạn. Giao dịch các công cụ tài chính mang mức độ rủi ro cao và có thể không phù hợp với tất cả nhà đầu tư. Công cụ này không cấu thành lời khuyên đầu tư hay tài chính. Hiệu suất trong quá khứ không đảm bảo kết quả trong tương lai. Rất khuyến khích thử nghiệm bất kỳ chiến lược nào trên tài khoản demo trước khi mạo hiểm vốn thực.
Tóm tắt
Đánh giá của khách hàng
5 | 67 % | |
4 | 33 % | |
3 | 0 % | |
2 | 0 % | |
1 | 0 % |


![Logo "[CB] Pivot Points Pro"](https://cdn.ctrader.com/image/webp/43463c82-67b0-4f10-a4ba-901bba091d81_32594)


![Logo "[Stellar Strategies] MARSI Signal Plotter"](https://cdn.ctrader.com/image/webp/7b2b8da6-8f8e-4646-8d4a-4710c516c01e_25567)