
Mô tả
HỆ THỐNG ĐÁM MÂY SMARTRSI - Công Cụ Phân Tích Động Lực Tiên Tiến
Biến đổi phân tích RSI của bạn với chỉ báo cách mạng này kết hợp công nghệ làm mượt Heikin Ashi với RSI lấy trung tâm tại số 0 để có các tín hiệu động lực rõ ràng như pha lê. Khác với các chỉ báo RSI truyền thống có thể ồn ào và khó diễn giải, Hệ Thống Đám Mây SmartRSI lọc bỏ nhiễu thị trường và làm nổi bật động lực hướng đi thực sự.
TÍNH NĂNG CHÍNH:
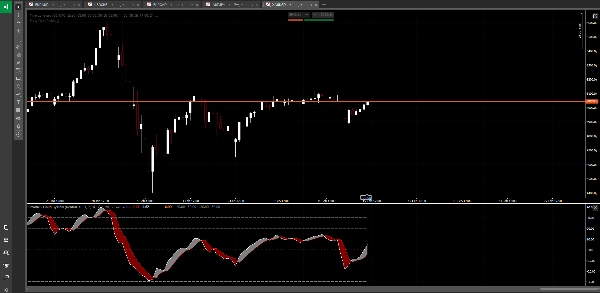
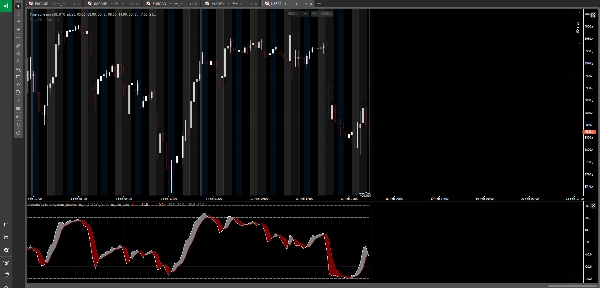
☁️ Đám Mây Heikin Ashi RSI
Trải nghiệm phân tích động lực được làm mượt với các hình thành đám mây trực quan. Đám mây ngay lập tức cho bạn thấy sức mạnh và hướng đi của động lực thị trường, giúp việc nhận diện xu hướng trở nên dễ dàng.
⚖️ RSI Lấy Trung Tâm Tại Số 0
Xem động lực chính xác như nó vốn có - lấy trung tâm tại số 0 để rõ ràng thiên hướng tăng/giảm. Giá trị dương biểu thị sức mạnh người mua, giá trị âm cho thấy áp lực người bán. Không còn phải đoán xem RSI đang tăng hay giảm.
🎯 Công Nghệ Làm Mượt Thông Minh
Loại bỏ tín hiệu sai với việc làm mượt RSI thông minh. Chỉ báo áp dụng nguyên tắc Heikin Ashi vào tính toán RSI, giảm đáng kể các tín hiệu nhiễu trong khi vẫn giữ độ chính xác của tín hiệu.
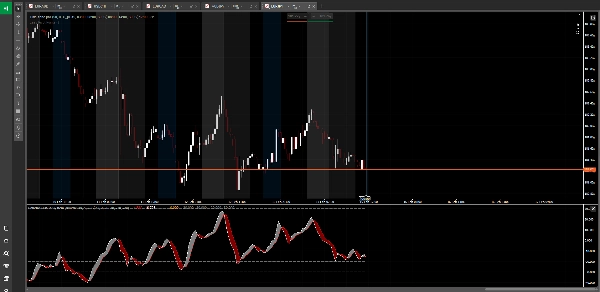
🔄 Chế Độ Nhà Giao Dịch Thích Ứng
Chuyển đổi giữa ba chế độ giao dịch:
• Chế Độ Trung Tính - Xem tất cả các tín hiệu
• Chế Độ Người Mua - Lọc chỉ các cơ hội mua dài
• Chế Độ Người Bán - Lọc chỉ các cơ hội bán ngắn
📊 Các Vùng Quá Mua/Quá Bán Đa Cấp
Bốn cấp độ riêng biệt giúp bạn đánh giá các cực điểm động lực:
• Mức OB/OS tiêu chuẩn cho cảnh báo ban đầu
• Mức OB/OS cực đoan cho vùng đảo chiều
• Hoàn toàn tùy chỉnh để phù hợp với phong cách giao dịch của bạn
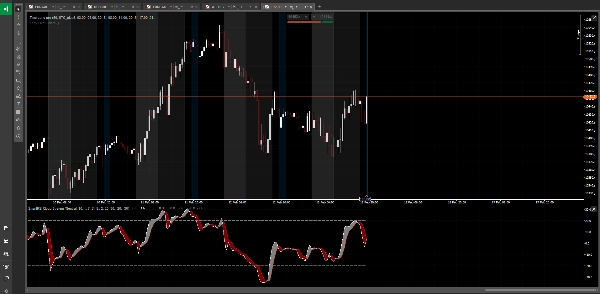
🎨 Trực Quan Chuyên Nghiệp
Hiển thị sạch sẽ, trực quan với:
• Các hình thành đám mây mã màu
• Đường vẽ RSI tùy chọn với màu sắc có thể tùy chỉnh
• Các mức giới hạn rõ ràng
• Đường tham chiếu số 0 để nhận diện thiên hướng ngay lập tức
⚙️ Hoàn Toàn Tùy Chỉnh
Điều chỉnh mọi khía cạnh:
• Độ dài HARSI và các tham số làm mượt
• Chu kỳ tính toán RSI
• Mức quá mua/quá bán
• Các yếu tố trực quan và màu sắc
• Tùy chọn chế độ nhà giao dịch
PHÙ HỢP CHO:
• Nhận diện các xu hướng động lực mạnh
• Phát hiện sự phân kỳ giữa giá và động lực
• Định thời điểm vào lệnh trong điều kiện quá mua/quá bán
• Lọc giao dịch dựa trên thiên hướng thị trường
• Xác nhận các đột phá và tiếp diễn xu hướng
• Phân tích động lực đa khung thời gian
ĐIỂM KHÁC BIỆT:
Các chỉ báo RSI truyền thống cho bạn dữ liệu động lực thô có thể dao động và gây hiểu nhầm. Hệ Thống Đám Mây SmartRSI áp dụng làm mượt cấp độ tổ chức trong khi vẫn giữ nguyên tính chính xác của tín hiệu. Cách tiếp cận lấy trung tâm tại số 0 loại bỏ sự nhầm lẫn về hướng động lực, và hình ảnh đám mây giúp các mẫu động lực phức tạp trở nên dễ nhận biết ngay lập tức.
Dù bạn đang giao dịch lướt sóng, giao dịch trong ngày hay giao dịch theo xu hướng, công cụ này mang lại cho bạn sự rõ ràng về động lực thị trường mà các chỉ báo tiêu chuẩn không thể cung cấp.
---
⚠️ CẢNH BÁO RỦI RO:
Giao dịch ngoại hối, tiền điện tử và các công cụ tài chính khác mang mức độ rủi ro cao và có thể không phù hợp với tất cả nhà đầu tư. Đòn bẩy cao có thể gây bất lợi cũng như có lợi cho bạn. Trước khi quyết định giao dịch, bạn nên cân nhắc kỹ mục tiêu đầu tư, mức độ kinh nghiệm và khả năng chịu rủi ro của mình. Có khả năng bạn sẽ chịu mất một phần hoặc toàn bộ khoản đầu tư. Do đó, bạn không nên đầu tư số tiền mà bạn không thể chịu mất. Bạn nên nhận thức đầy đủ về tất cả các rủi ro liên quan đến giao dịch và tìm lời khuyên từ cố vấn tài chính độc lập nếu có bất kỳ nghi ngờ nào. Hiệu suất trong quá khứ không phải là chỉ báo cho kết quả tương lai.
Tóm tắt
Đánh giá của khách hàng
5 | 100 % | |
4 | 0 % | |
3 | 0 % | |
2 | 0 % | |
1 | 0 % |


