
Description
Fibonacci Moyenne Quotidienne - Niveaux Fibonacci Quotidiens Automatiques
Projette la plage moyenne quotidienne en niveaux de Fibonacci à partir de l'ouverture de la journée
Que fait cet indicateur ?
Fibonacci Moyenne Quotidienne trace automatiquement des niveaux de Fibonacci basés sur la plage moyenne quotidienne. Chaque jour, l'indicateur projette des niveaux clés à la fois vers le haut et vers le bas à partir du prix d'ouverture, vous aidant à identifier des objectifs potentiels et des zones de retournement.
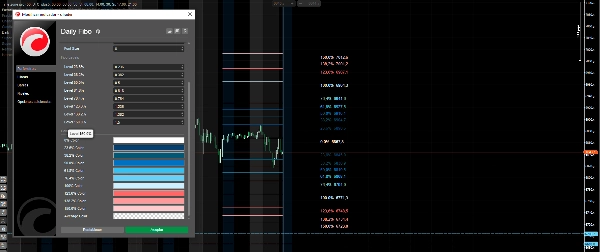
Caractéristiques principales
✅ Mise à jour quotidienne automatique - Les niveaux sont automatiquement redessinés chaque jour ✅ Niveaux personnalisables - Configurez jusqu'à 8 niveaux de Fibonacci différents ✅ Couleurs personnalisées - Chaque niveau a sa propre couleur identifiable ✅ Étiquettes avec prix - Affiche à la fois le pourcentage et le prix exact de chaque niveau ✅ Moyenne journalière ajustable - Choisissez le nombre de jours à utiliser pour le calcul de la moyenne (par défaut 20)
Niveaux inclus par défaut
- 0% - Ouverture de la journée (ligne de base)
- 23,6%, 38,2%, 50%, 61,8%, 76,4% - Retracements et extensions internes
- 100% - Plage moyenne complète
- 123,6%, 138,2%, 150% - Extensions externes
Comment utiliser l'indicateur
- Identifier la direction - Le prix d'ouverture (0%) est votre point de référence
- Chercher des objectifs haussiers - Les niveaux supérieurs marquent les objectifs d'achat
- Chercher des objectifs baissiers - Les niveaux inférieurs marquent les objectifs de vente
- Zones de retournement - Lorsque le prix atteint des niveaux extrêmes (100%+), recherchez des retournements possibles
Paramètres ajustables
- Jours pour le calcul de la moyenne
- Niveaux de Fibonacci personnalisés
- Couleurs individuelles par niveau
- Afficher/masquer les étiquettes et les prix
- Taille de la police
Parfait pour les traders recherchant des objectifs clairs et des zones de prix probables pendant la session de trading.
Résumé
Avis clients
5 | 50 % | |
4 | 50 % | |
3 | 0 % | |
2 | 0 % | |
1 | 0 % |


