
Mô tả
Một chỉ báo khối lượng đa chế độ tiên tiến với ba chế độ phân tích riêng biệt. Chuyển đổi ngay lập tức giữa chúng để phù hợp với phong cách giao dịch của bạn.
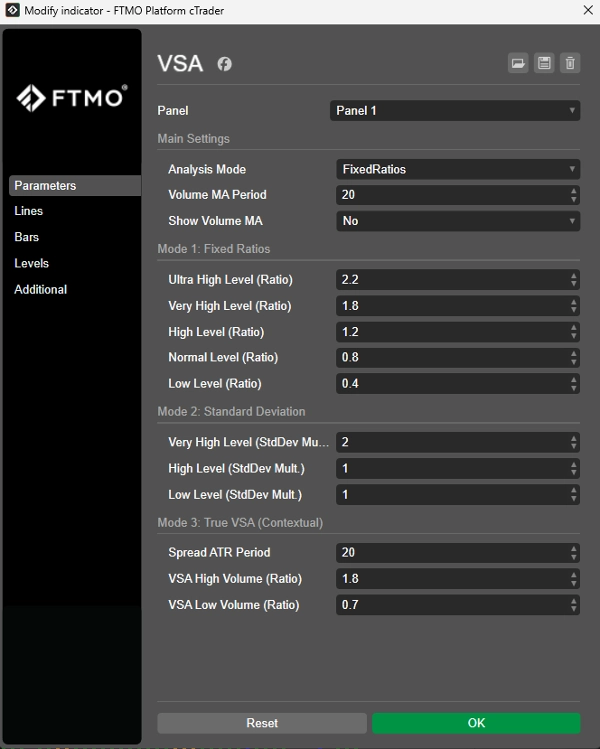
Chế độ 1: Tỷ lệ cố định
Phân loại khối lượng bằng cách so sánh nó với trung bình động nhân với các tỷ lệ cố định do người dùng định nghĩa (ví dụ: 2,0x cho "Cao").
Phù hợp nhất cho: Các nhà giao dịch thích kiểm soát thủ công và ngưỡng cố định.
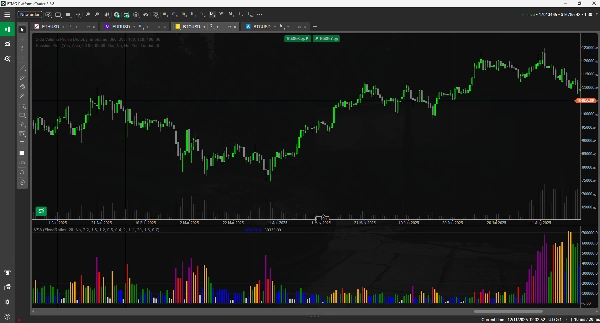
Chế độ 2: Độ lệch chuẩn (Thích ứng)
Chế độ này tự động điều chỉnh theo biến động thị trường. Nó phân loại khối lượng dựa trên số độ lệch chuẩn mà nó cách xa trung bình (trung bình động).
Phù hợp nhất cho: Một công cụ thích ứng hoạt động "ngay khi sử dụng" trên bất kỳ công cụ hoặc khung thời gian nào.
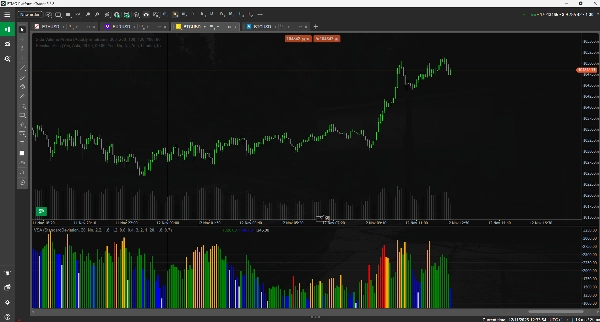
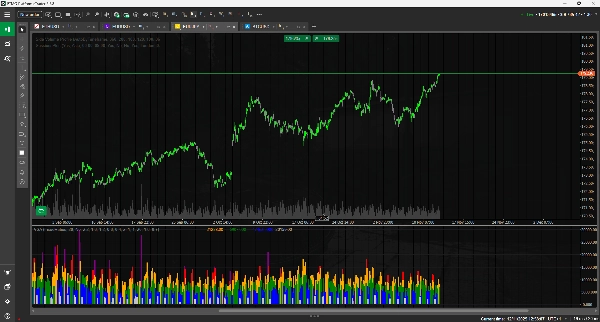
Chế độ 3: True VSA (Ngữ cảnh)
Phương pháp cổ điển, chuyên nghiệp. Chế độ này phân tích ngữ cảnh của thanh bằng cách kết hợp Khối lượng + Biên độ (Phạm vi) + Vị trí đóng để xác định các tín hiệu chính.
Tóm tắt
1. Fixed Ratios mode categorizes volume by comparing it to a moving average multiplied by user-defined fixed ratios, providing manual control over volume thresholds.
2. Standard Deviation mode adapts automatically to market volatility by classifying volume based on its deviation from the moving average, suitable for use across various instruments and timeframes without manual adjustment.
3. True VSA (Contextual) mode applies a professional volume spread analysis by evaluating volume in conjunction with bar range and close position to identify key market signals.
This multi-mode indicator supports a wide range of markets including Forex, cryptocurrencies (e.g., BTCUSD, ETH), commodities (e.g., gold, oil), indices (e.g., NAS100, SP500), and stocks. It enables traders to switch instantly between modes to align with their preferred analysis style and trading strategy.
Đánh giá của khách hàng
5 | 100 % | |
4 | 0 % | |
3 | 0 % | |
2 | 0 % | |
1 | 0 % |


