
Mô tả
Làm mịn Jurik bao gồm 3 giai đoạn:
Giai đoạn 1 - làm mịn sơ bộ bằng EMA thích ứng: MA1 = (1-alpha)*Price + alpha*MA1[1];
Giai đoạn 2 - làm mịn sơ bộ thêm một lần nữa bằng bộ lọc Kalman: Det0 = (Price - MA1)*(1-beta) + beta*Det0[1]; MA2 = MA1 + PR*Det0;
Giai đoạn 3 - làm mịn cuối cùng bằng bộ lọc thích ứng Jurik độc đáo: Det1 = (MA2 - JMA[1]) * (1-alpha)^2 + alpha^2 * Det1[1]; JMA = JMA[1] + Det1;
trong đó: - Price - Chuỗi giá - alpha - hệ số động (sẽ được mô tả bên dưới) - beta - tỷ lệ chu kỳ = 0.45*(Length-1)/(0.45*(Length-1)+2) - PR - Tỷ lệ Pha: PR = Phase/100 + 1.5 (nếu Phase < -100 thì PR=0.5, nếu Phase > 100 thì PR=2.5).
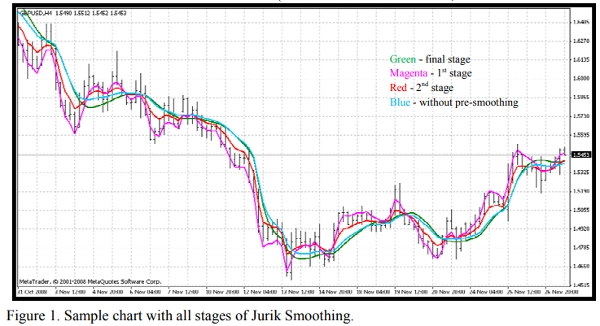
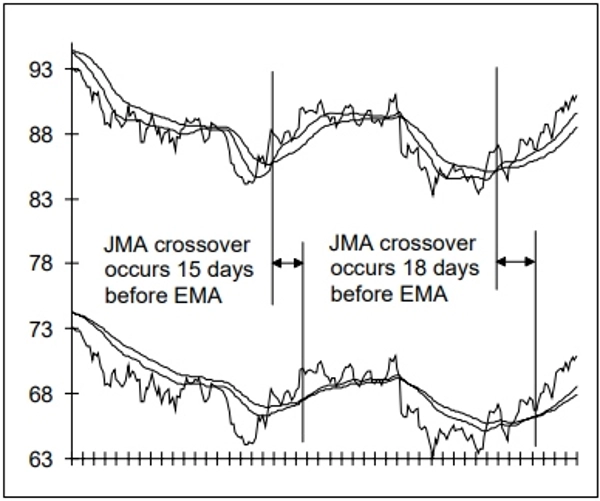
Hình 1. Biểu đồ mẫu với tất cả các giai đoạn của Làm mịn Jurik. Bạn có thể thấy kết quả (Hình 1) của mỗi giai đoạn bằng cách sử dụng chỉ báo đính kèm JurikFilter_v2, thay đổi FilterMode: 0 - giai đoạn cuối cùng (JMA) 1 - giai đoạn 1 2 - giai đoạn 2 3 - chỉ làm mịn cuối cùng (không có làm mịn sơ bộ).
Hệ số Động là hệ số chu kỳ (beta) được nâng lên một lũy thừa (pow):
alpha = beta ^ Pow,
trong đó: - pow = rVolty ^ pow1 - rVolty - độ biến động giá tương đối - pow1 - lũy thừa của độ biến động tương đối với công thức sau: pow1 = len1 - 2 (nếu pow1 < 0.5 thì pow1 = 0.5),
trong đó len1 - hệ số chu kỳ bổ sung: len1 = Log(SquareRoot(len))/Log(2.0) + 2 (nếu len1 < 0 thì len1 = 0).
Do đó bạn có thể thấy rằng Hệ số Động dựa trên độ biến động giá tương đối, cung cấp khả năng thích ứng cần thiết cho loại bộ lọc giá này.
Công thức cho độ biến động giá tương đối là rVolty = Volty/AvgVolty (nếu rVolty > len1^(1/pow1) thì rVolty = len1^(1/pow1), nếu rVolty < 1 thì rVolty = 1),
trong đó:
- Volty - độ biến động giá dựa trên tính toán các dải Jurik (VisualMode = 1).
- AvgVolty - độ biến động trung bình mà Jurik sử dụng thuật toán tính toán khá phức tạp: AvgVolty = Average(vSum,AvgLen),
trong đó:
- vSum - tổng cộng dồn của (Volty - Volty[10])/10;
- AvgLen - chu kỳ trung bình (Jurik sử dụng 65).
Trong phiên bản của tôi về Bộ lọc Jurik, tôi sử dụng trung bình đơn giản thay vì trung bình phức tạp của Jurik
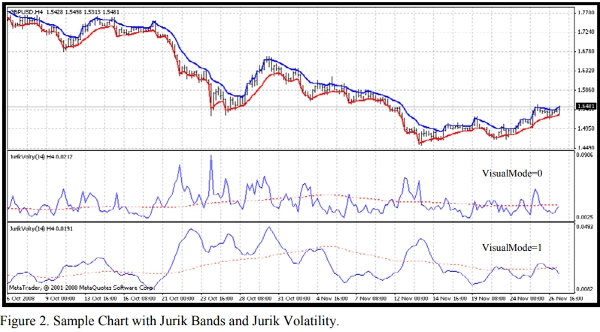
Hơn nữa, với chỉ báo đính kèm JurikVolty_v1 (Hình 2) bạn có thể thấy các giá trị cho Volty (VisualMode=0), vSum (VisualMode=1) và AvgVolty (đường chấm đỏ).
Công thức cho độ biến động giá là Volty = max giữa Abs(del1) và Abs(del2), nếu Abs(del1) = Abs(del2) thì Volty = 0,
trong đó: - del1 - khoảng cách giữa giá và dải trên del1 = Price - UpperBand - del2 - khoảng cách giữa giá và dải dưới del2 = Price - LowerBand Các dải Jurik khác với bất kỳ dải giá nào đã biết như Bollinger, Keltner, Donchian, Fractal và v.v.: nếu del1 > 0 thì UpperBand = Price còn không thì UpperBand = Price - Kv*del1 nếu del2 < 0 thì LowerBand = Price còn không thì LowerBand = Price - Kv*del2,
trong đó: - Kv - hệ số biến động Kv = bet ^ SquareRoot(pow2). Rất dễ thấy rằng các dải này có thể là cơ sở cho chỉ báo theo xu hướng như Wilder's Parabolic. Vì vậy, bạn có thể thấy chúng ta thực sự không có những chỗ mơ hồ trong thuật toán của Trung bình Động Jurik (JMA)
Tóm tắt
Đánh giá của khách hàng
5 | 0 % | |
4 | 100 % | |
3 | 0 % | |
2 | 0 % | |
1 | 0 % |


