
Beschreibung
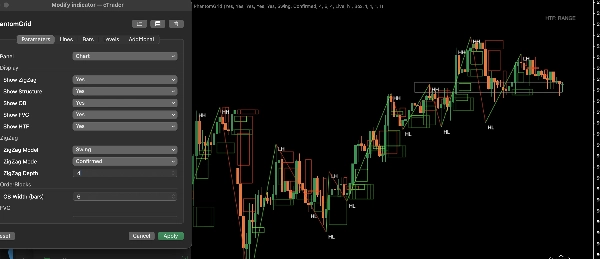
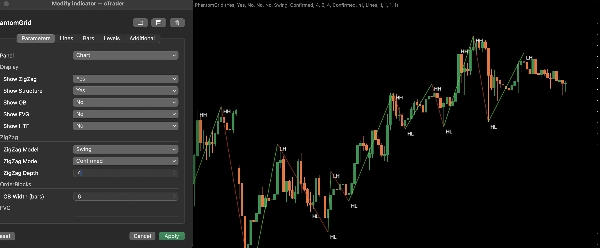
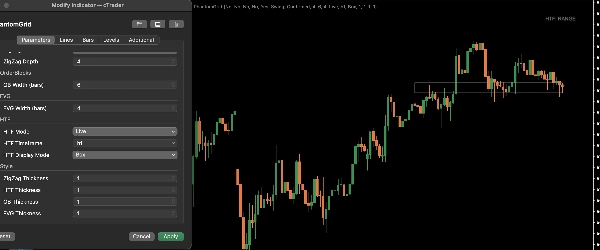
PhantomGrid ist ein professioneller Raster-Visualisierungsindikator, der Klarheit, Struktur und Präzision in die Preisaktionsanalyse bringt.
Er zeichnet automatisch dynamische Rasterebenen über jedes Symbol und jeden Zeitrahmen, um Händlern zu helfen, Reaktionszonen zu identifizieren, Ein- und Ausstiege zu verfeinern und Trades mit größerer Konsistenz zu planen.
PhantomGrid ist sowohl für diskretionäre als auch systematische Händler konzipiert, die einen klaren, strukturierten Rahmen ohne unnötige Chart-Unordnung wünschen. Der Indikator passt sich reibungslos an wechselnde Marktbedingungen an und bewahrt dabei visuelle Klarheit und Genauigkeit in verschiedenen Umgebungen.
Hauptmerkmale
• Automatische dynamische Rasterdarstellung über alle Symbole und Zeitrahmen
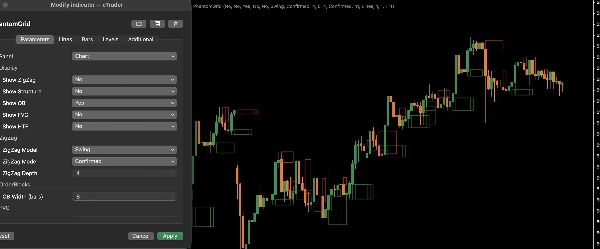
• Hilft bei der Identifizierung von Reaktionszonen, Liquiditätsbereichen und strukturierten Setups
• Sauberes, minimalistisches visuelles Design für ablenkungsfreie Analyse
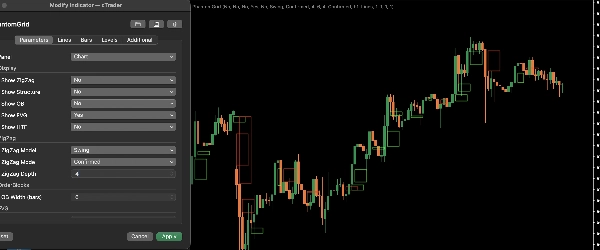
• Vollständig anpassbarer Rasterabstand, Stil und Verhalten
• Leichtgewichtig und für reibungslose Leistung optimiert
• Geeignet für Scalping-, Intraday- und Swing-Trading-Workflows
Wie Händler PhantomGrid verwenden
PhantomGrid hilft Händlern:
• die Marktbewegung klarer zu strukturieren
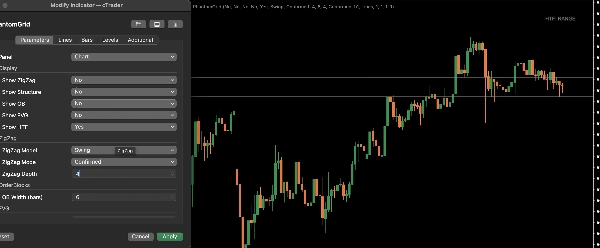
• hochwahrscheinliche Reaktionsbereiche zu identifizieren
• das Timing für Ein- und Ausstiege zu verbessern
• Trades systematischer zu verwalten
• Konsistenz über verschiedene Instrumente hinweg zu bewahren
Es funktioniert effektiv als eigenständiges Werkzeug oder in Kombination mit bestehenden Strategien und Workflows.
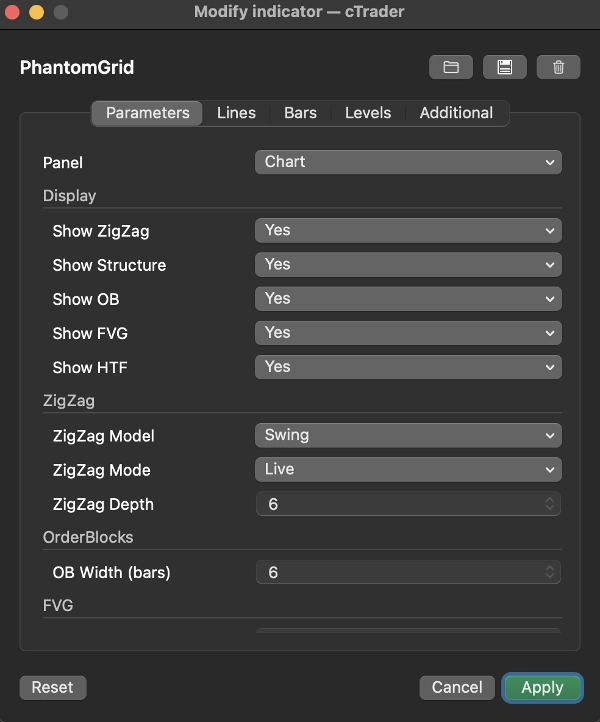
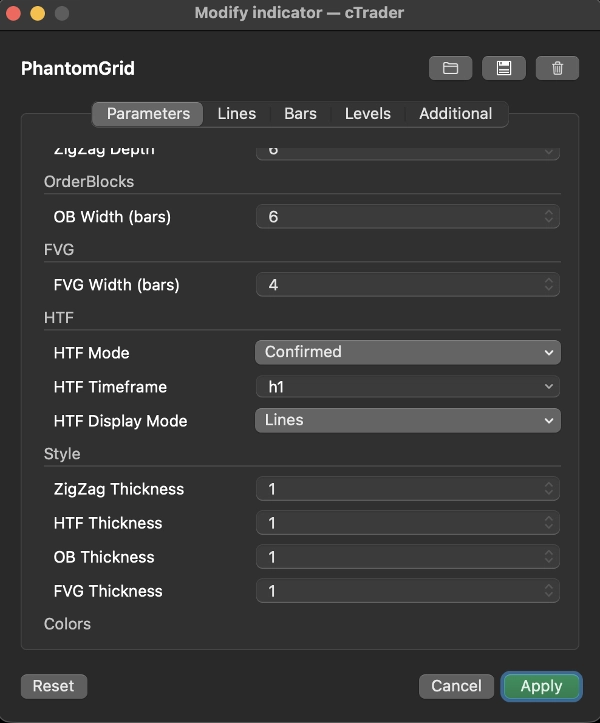
Anpassungsoptionen
PhantomGrid bietet flexible Einstellungen, um verschiedene Handelsstile zu unterstützen:
• Steuerung des Rasterabstands
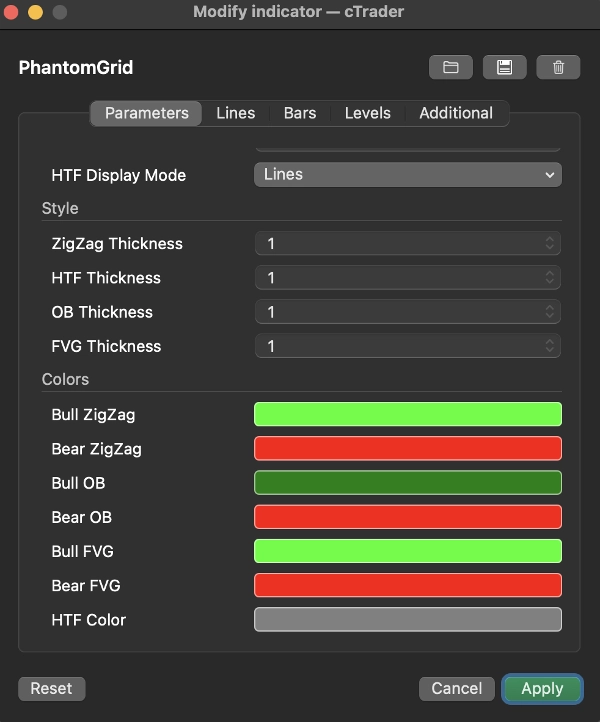
• visuelle Gestaltung und Farbeinstellungen
• Sichtbarkeitsanpassungen für sauberere Layouts
• Verhaltensanpassung für unterschiedliche Volatilitätsbedingungen
Diese Optionen ermöglichen es Händlern, den Indikator genau an ihren Workflow und ihre Präferenzen anzupassen.
Leistung & Kompatibilität
PhantomGrid ist für stabile, effiziente Leistung konzipiert und läuft reibungslos über alle unterstützten Symbole und Zeitrahmen innerhalb von cTrader. Der Indikator integriert sich nahtlos in professionelle Chart-Setups, ohne die Plattformleistung zu verlangsamen.
Beinhaltet eine vollständige 7-Tage-Testversion. Keine Einschränkungen.
Vergangene Leistungen garantieren keine zukünftigen Ergebnisse. Dieser Indikator dient nur zu Informationszwecken und stellt keine Finanzberatung dar.
Zusammenfassung
Kundenbewertungen
5 | 100 % | |
4 | 0 % | |
3 | 0 % | |
2 | 0 % | |
1 | 0 % |


![„[Hamster-Coder] Pivot Points MTF“-Logo](https://cdn.ctrader.com/image/webp/4c143e5a-309c-40e3-a578-f04d1e133ffa_31159)


