present
Đăng ký và nhận ưu đãi $50 cho lần mua đầu tiên
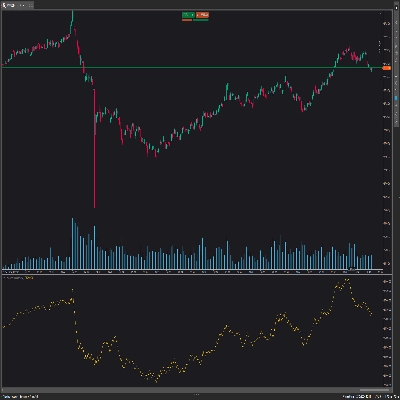
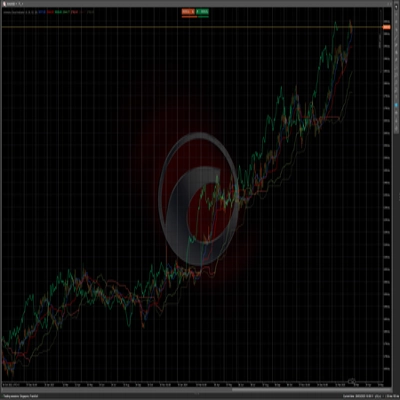
Trading product for Machine Learning Momentum Index Chỉ báo Indices AI, image 1
Machine Learning Momentum Index
4.5
Đánh giá: 2
2
Lượt bán
7.3K
Cài đặt miễn phí

Mô tả

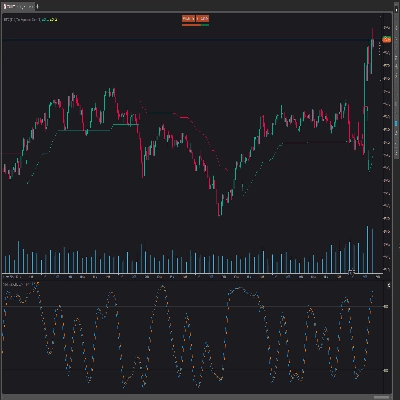
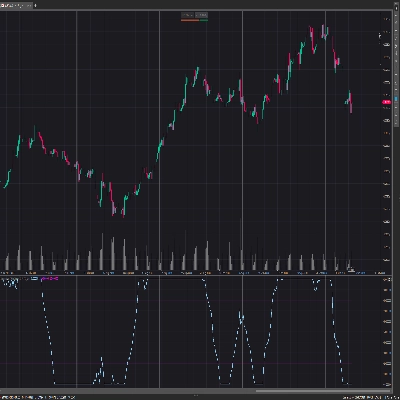
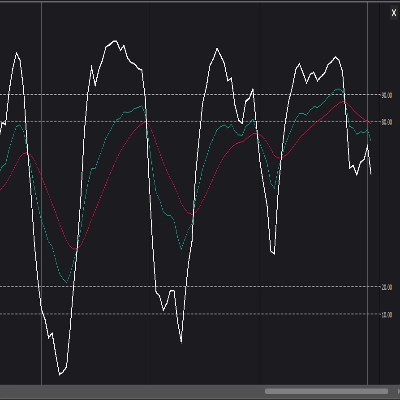
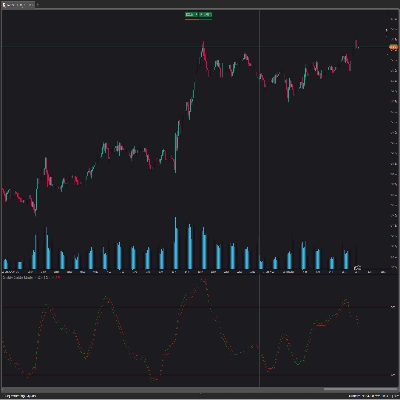
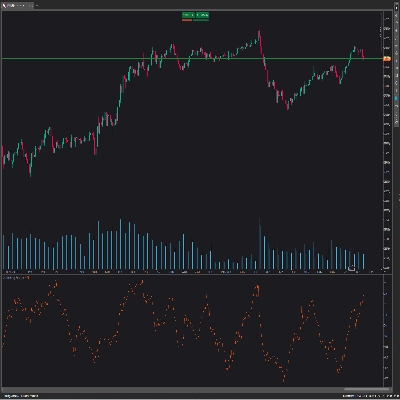
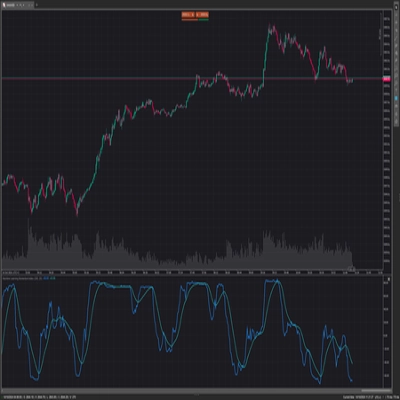
Chỉ số Đà Máy học (MLMI) Machine Learning Momentum Index (MLMI) đại diện cho bước tiếp theo trong giao dịch dao động. Bằng cách kết hợp phân tích đà truyền thống với máy học, MLMI cung cấp một công cụ mạnh mẽ và năng động phù hợp với những phức tạp của cảnh quan tài chính hiện đại. Cung cấp cho các nhà giao dịch một cách thích ứng để hiểu và hành động dựa trên đà và xu hướng thị trường, dao động này cung cấp những hiểu biết theo thời gian thực về đà thị trường và các xu hướng hiện hành

Tóm tắt

Tóm tắt AI
The Machine Learning Momentum Index (MLMI) is an advanced oscillator that integrates traditional momentum analysis with machine learning techniques. Designed to provide real-time insights, MLMI helps traders assess market momentum and identify prevailing trends dynamically. By adapting to the complexities of modern financial markets, this indicator offers an enhanced approach to momentum trading. It is applicable across various indices, including Nasdaq, S&P 500, DAX, and Dow, supporting traders in making informed decisions based on evolving market conditions.
Hồ sơ chỉ báo

Thảo luận

Đánh giá của khách hàng

4.5
Đánh giá: 2
5
50 %
4
50 %
3
0 %
2
0 %
1
0 %
Đánh giá của khách hàng
July 9, 2025
Pros: Combines RSI-based WMAs and k‑NN machine learning for adaptive momentum detection. Highlights trend changes and consolidation zones. Cons: No alerts or tooltips. Less effective on higher timeframes. Requires other confirmation tools to trade reliably.
April 26, 2025
Accuracy

Câu hỏi thường gặp

Indices
AI
Các sản phẩm có sẵn trên cTrader Store, bao gồm bot giao dịch, chỉ báo và plugin, được cung cấp bởi các nhà phát triển bên thứ ba và chỉ nhằm mục đích cung cấp thông tin và tiếp cận kỹ thuật. cTrader Store không phải là nhà môi giới và không cung cấp lời khuyên đầu tư, khuyến nghị cá nhân hay bất kỳ đảm bảo nào về hiệu suất trong tương lai.

Sản phẩm khác của tác giả này
Logo "PMAX"
5.0
(6)
Miễn phí
It's a combination of two trailing stop loss and the other one is well-known ATR-based SuperTrend.
Stochastic RSI (StochRSI) is a technical indicator used to measure the strength and weakness of the RSI.
Laguerre RSI is based on John EHLERS' Laguerre Filter to avoid the noise of RSI.
The KDJ oscillator display consists of 3 lines (K, D and J - hence the name of the display) and 2 levels.
The Darvas Box involves identifying "boxes" or trading ranges where a stock's price consolidates before breaking out.
On Balance Volume (OBV) measures buying and selling pressure as a cumulative indicator.
The Ichimoku Cloud is a comprehensive technical analysis system developed by Japanese journalist Goichi Hosoda
The QQE (Quantitative Qualitative Estimation) Weighted Oscillator improves its original version by weighting the RSI.
Chaikin money flow's primary purpose is to distinguish between periods of accumulation and distribution of a security.

Bạn cũng có thể thích

Candles Volume Delta is a powerful, visually intuitive indicator that transforms raw tick volume into actionable trading
Logo "PriceLevels"
4.7
(4)
$19
Displays the previous day's, last week's, and last month's highest and lowest price levels on your chart.
Logo "MARainbow"
4.2
(4)
$19
/
$38
MARainbow gives you the edge with four customizable moving averages—each color-coded for instant recognition.
Multi VWAP. Three timeframes. One clean chart. Your Essential Trading Tool.
Pro Structure & Candlestick Patterns Detector
Support Resistance Toolkit
ORB Range Indicator maps the opening range and gives a practical session-breakout workflow with clear labels.
Chart control panel — zoom presets, timeframe selector, favorite chart buttons, chart type switcher, and bid/ask lines.
Logo "Swing Points"
4.5
(6)
$19
Multi-Timeframe Swing Points Indicator for cTrader that identifies swing highs and lows on both the current timeframe.
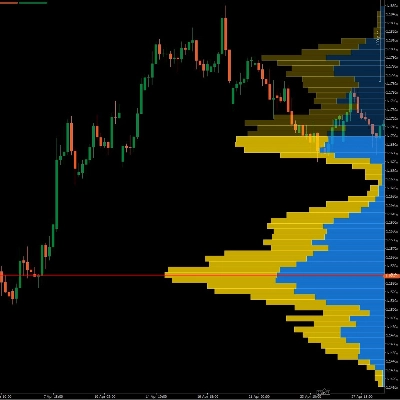
Dynamic Visible Range Volume Profile for cTrader. Real-time POC, Value Area & Smart Alerts for precise trading.
Trend-filtered signals, transparent trade plans and a multi-timeframe decision panel for cTrader.
Instantly spot high-liquidity institutional moves with clean, non-obtrusive triangle alerts on cTrader charts.
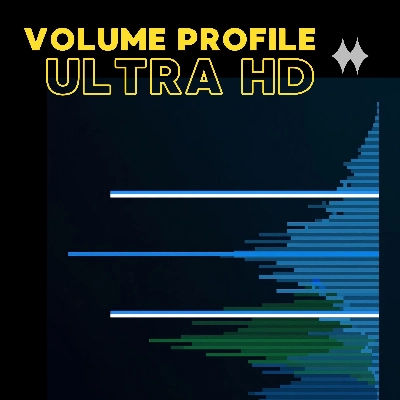
Rolling Volume Profile MTF with 24H, 7D, 30D profiles and a precise NY Open marker.
Stop trading with tunnel vision! 🚫 The Heat Map Dashboard is an institutional-grade visual trading assistant
ADVANCED ICT + ADR + AWR SUITE PRO (The Ultimate All-in-One Toolkit for Price Action Traders)
Trend direction, chart signals, reversal zones and volume tools in one configurable indicator.
a visually very powerful tool for analyzing "opposing forces".
This Indicator will show you Direction, Distance, and Time;

Giá

2
Lượt bán
7.3K
Cài đặt miễn phí