
Side Volume Profile
Indikator
11 pembelian
Versi 1.0, Aug 2025
Windows, Mac
4.3
Ulasan: 3
Sejak 26/05/2025
389.95M
Volume trading
60.75K
Pip dimenangkan
15
Penjualan
1.41K
Instal gratis
Deskripsi
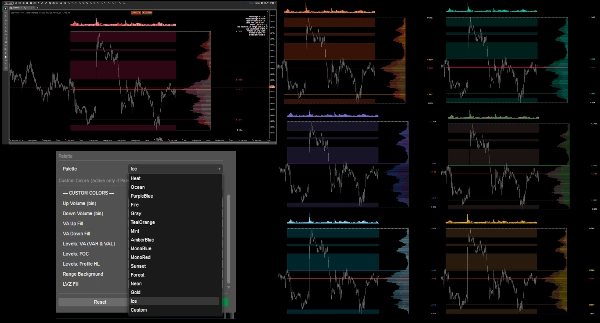
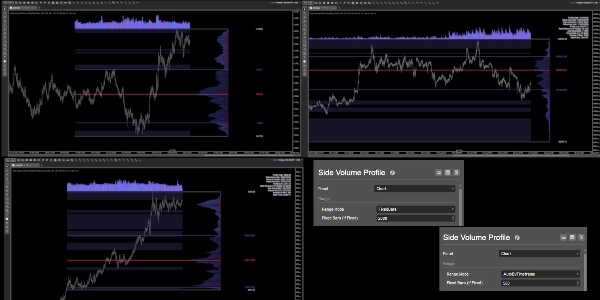
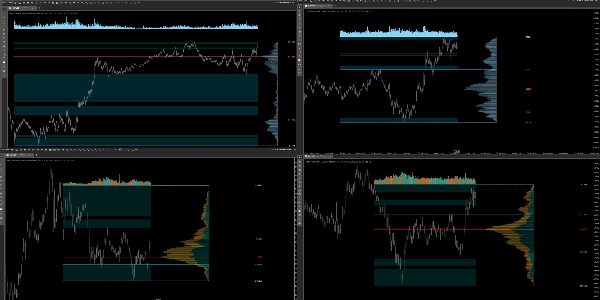
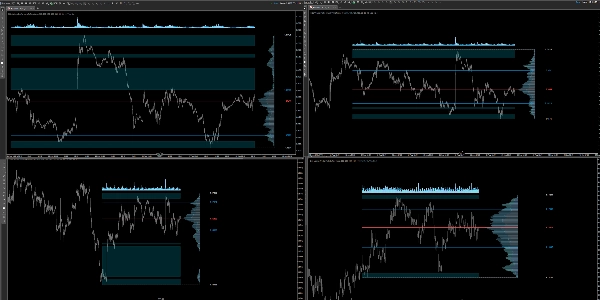
Profil Volume sisi kanan, yang selalu dipasang pada bar terakhir dan tidak melompat saat Anda menggeser grafik. Ini menghitung volume-per-harga selama rentang yang dipilih (otomatis berdasarkan kerangka waktu atau jumlah bar tetap), menampilkan POC, VAH/VAL, batas profil (Tinggi/Rendah), menyoroti zona volume rendah (LVZ), dan menggambar histogram volume dengan EMA di atas rentang (offset dalam pips). Termasuk panel statistik di kanan atas, beberapa palet kontras tinggi plus warna kustom, opasitas bin global, kontrol lebar/offset, dan ketebalan/gaya per garis. Dibangun untuk keterbacaan dan kinerja.
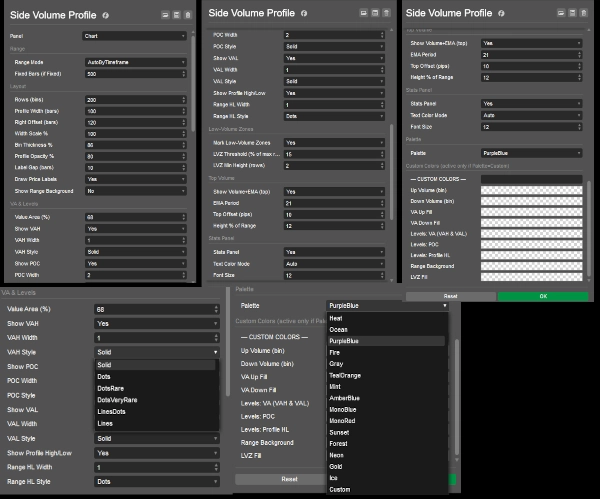
- Range: AutoByTimeframe atau FixedBars.
- Layout: Baris (bin), Lebar Profil / Skala Lebar, Offset Kanan, Ketebalan Bin, Jarak Label, opasitas profil; latar belakang rentang opsional.
- VA & Levels: Persentase Area Nilai, toggle VAH/POC/VAL, lebar & gaya garis per level; Tinggi/Rendah profil.
- Low-Volume Zones: Ambang batas (% dari baris maksimum) dan tinggi minimum (baris).
- Top Volume: Periode EMA, tinggi (% dari rentang), offset default 10 pips.
- Palette/Custom: Pilih tema atau atur warna Anda sendiri (VAH = VAL).
- Stats Panel: Toggle, ukuran font
Dokumentasi indikator
Ringkasan
Ringkasan AI
Side Volume Profile is a right-anchored volume profile indicator designed for cTrader that displays volume-by-price data over a selectable range, either automatically by timeframe or a fixed number of bars. It visualizes key volume levels including Point of Control (POC), Value Area High (VAH), Value Area Low (VAL), and profile bounds (high/low). The indicator highlights low-volume zones (LVZ) based on configurable thresholds and minimum heights. It also features a volume histogram with an exponential moving average (EMA) offset in pips above the profile range.
Users can customize the layout with controls for row bins, profile width and scale, right offset, bin thickness, label gaps, and opacity. Line widths and styles for VAH, POC, VAL, and profile bounds are adjustable. Multiple high-contrast color palettes and custom color options are available. A toggleable top-right statistics panel provides summary data with adjustable font size.
The indicator supports various markets including Forex, indices, commodities, cryptocurrencies, and stocks, with tags referencing symbols like BTCUSD, EURUSD, GBPUSD, XAUUSD, NAS100, and USDJPY. It is built for readability and performance, maintaining a stable position on the chart without shifting when panning.
Profil indikator
Ulasan pelanggan
4.3
Ulasan: 3
5 | 33 % | |
4 | 67 % | |
3 | 0 % | |
2 | 0 % | |
1 | 0 % |
Ulasan pelanggan
Diskusi
Pertanyaan umum
BTCUSD
Forex
Indices
EURUSD
Commodities
GBPUSD
NZDUSD
Prop
Fair Value Gap
SMC
Crypto
Stocks
XAUUSD
NAS100
USDJPY
VWAP
Produk-produk yang tersedia melalui cTrader Store, termasuk bot trading, indikator, dan plugin, disediakan oleh pengembang pihak ketiga serta hanya ditujukan untuk akses teknis dan informasi. cTrader Store bukan broker dan tidak menyediakan saran investasi, rekomendasi pribadi, atau jaminan apa pun tentang kinerja di masa mendatang.


Harga
Sejak 26/05/2025
389.95M
Volume trading
60.75K
Pip dimenangkan
15
Penjualan
1.41K
Instal gratis