
VolumeThermometer
指标
426 下载
版本 1.0, Aug 2025
Windows 版、Mac 版
说明
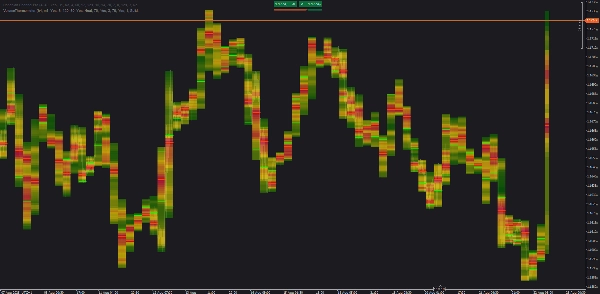
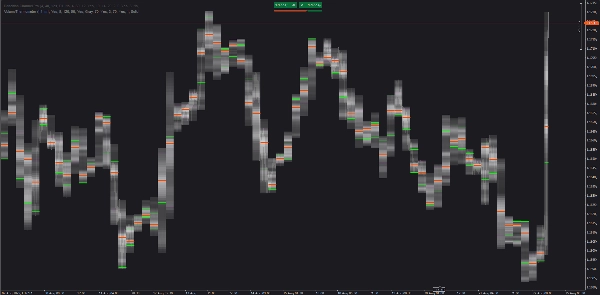
cTrader 热力图,显示成交量如何分布在每个高时间框架(HTF)蜡烛内。它使用低时间框架(LTF)柱(例如,M1)构建垂直成交量区间,然后绘制POC和价值区(VA)线。当前(未完成的)HTF 蜡烛实时绘制。
工作原理
- 汇总来自低时间框架柱的tick 成交量。
- 将每个高时间框架蜡烛拆分为
区间价格切片,并按价格重叠分配成交量。 - 按相对成交量为区间着色;绘制POC,可选的VA线,并可向右延伸它们。
- 仅自动加载可见范围的较旧历史(小批量)。
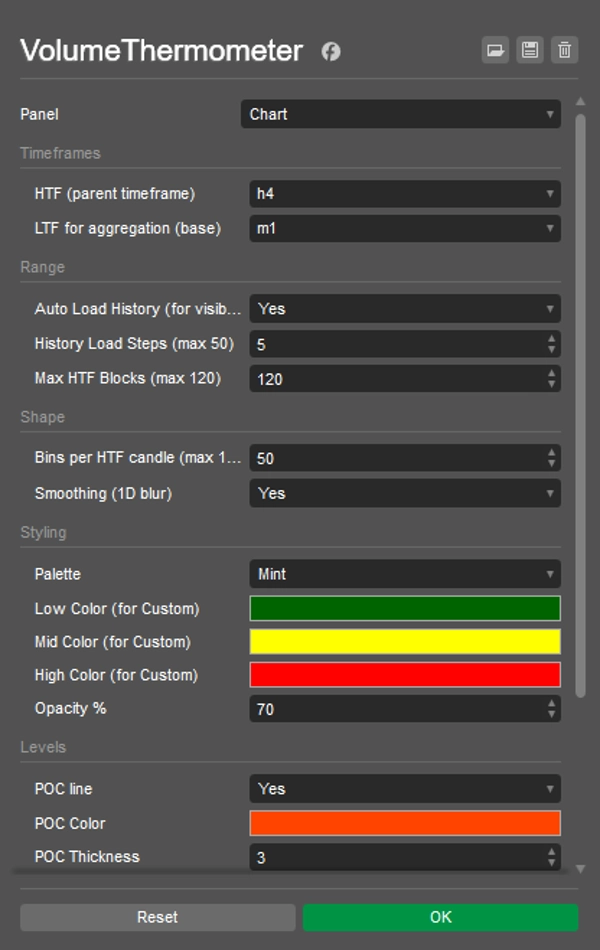
使用方法
- 选择高时间框架(HTF)(例如,H4)和低时间框架(LTF)(例如,M1)。
- 启用自动加载历史;滚动/缩放到所需范围。
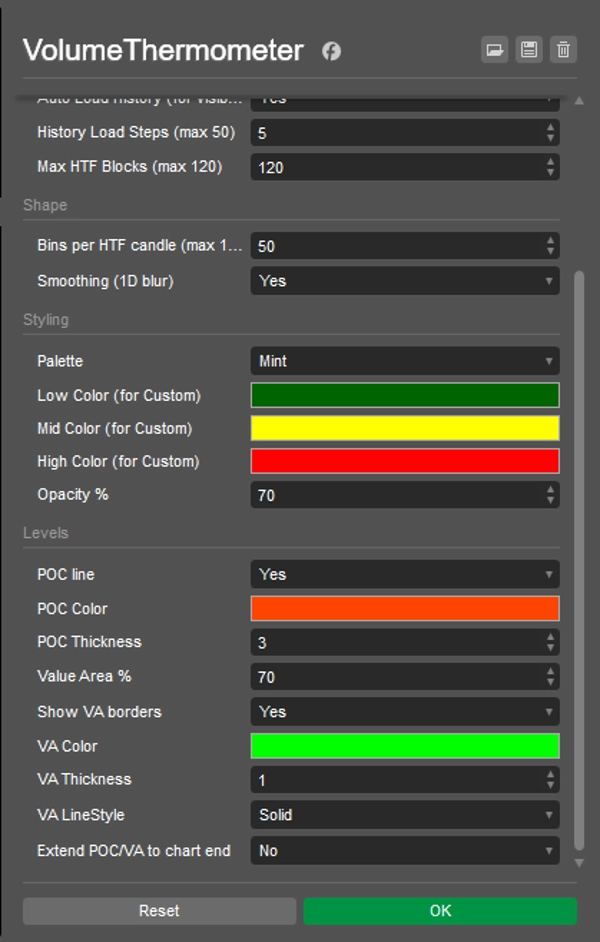
- 调整区间(Bins)(细节)、最大高时间框架块数(显示多少蜡烛)、平滑度、不透明度和颜色。
- 观察 POC/VA 反应以及 POC 如何在蜡烛间迁移。
快速想法
- POC 重测:首次触及先前 POC 并有低时间框架确认。
- VA 旋转:重新进入 VA 通常目标是 POC/其他 VA 边缘。
- LVN 通过:薄(冷)区域往往快速移动到下一个节点。
注意事项
- 使用tick 成交量(FX/CFD 上的良好代理,不是交易所成交量)。
- 为提升性能,必要时减少区间(Bins)或最大高时间框架块数。
摘要
AI 摘要
VolumeThermometer is a cTrader indicator that visualizes intra-higher timeframe (HTF) volume distribution using a heatmap. It aggregates tick volume data from lower timeframe (LTF) bars (e.g., M1) to construct vertical volume bins within each HTF candle (e.g., H4). The indicator highlights the Point of Control (POC) and Value Area (VA) lines, showing where the most volume is concentrated by price level. The current HTF candle is updated in real time, and the indicator automatically loads historical data for the visible chart range in small batches to optimize performance.
Key features include:
- Aggregation of tick volume from LTF bars.
- Division of HTF candles into price bins with volume assigned by price overlap.
- Color-coded volume bins indicating relative volume intensity.
- Display of POC and optional VA lines, with the ability to extend these lines forward.
- Customizable settings for bin detail, maximum HTF candles displayed, smoothing, opacity, and colors.
- Supports multiple markets including Forex, indices, commodities, stocks, and cryptocurrencies such as BTCUSD and EURUSD.
Users can monitor POC retests, VA rotations, and low volume node pass-throughs to analyze volume behavior within HTF candles. The indicator uses tick volume as a proxy, suitable for FX and CFD markets.
指标配置
客户评价
0.0
评价:0
客户评价
该产品尚无评价。已经试过了?抢先告诉其他人!
讨论
常见问答
BTCUSD
Prop
Forex
Indices
EURUSD
Commodities
Crypto
Stocks
NAS100
cTrader Store 提供的所有产品,包括交易机器人、指标和插件,均由第三方开发者提供,仅供信息参考和技术访问之用。cTrader Store 并非经纪商,不提供投资建议、个人推荐或任何未来业绩保证。


猜您喜欢


价格
注册日期 26/05/2025
451.48M
交易量
61.16K
盈利点数
15
销售
1.43K
免费安装