说明
Smart Money Concepts Pro v5.1 是一款为依赖自由裁量价格行为和智能资金概念分析的交易者打造的专业cTrader市场结构指标。它通过突出关键结构事件、流动性参考、不平衡区域和更高时间框架的背景,直接在图表上将原始价格走势转化为清晰的视觉框架。
该指标旨在帮助交易者理解价格如何与摆动高点和低点互动,结构何时被突破,特征何时发生变化,以及在活动区间内可能存在的溢价或折扣条件。它不是强制机械入场模型,而是提供支持纪律性交易计划和更清晰图表阅读所需的结构性背景。
它检测的内容
Smart Money Concepts Pro v5.1 包含一套广泛的结构和背景工具:
- 摆动高点和摆动低点检测
- HH、HL、LH 和 LL 标签
- 结构突破(BOS)
- 特征变化(CHoCH)
- 等高(EQH)和等低(EQL)
- 公平价值缺口(FVG)
- 之前的日线、周线和月线高低点水平
- 溢价、均衡和折扣区域
- 强弱高低点背景
- 当前摆动偏向显示
这些功能协同工作,提供对价格行为的结构化解读,同时避免图表过度拥挤。
主要优势
- 帮助快速识别方向性结构
- 突出潜在流动性目标和反应区域
- 为低时间框架执行添加更高时间框架背景
- 改善基于SMC分析的图表组织
- 支持自由裁量交易者而非自动化决策
- 提供可配置的显示控制,实现更清晰的工作流程
为自由裁量交易者设计
Smart Money Concepts Pro v5.1 适用于基于背景、叙述和价格表现而非纯指标信号做出决策的交易者。它特别适合那些:
- 交易市场结构和流动性概念
- 监控延续和反转行为
- 在计划中使用更高时间框架参考水平
- 希望在cTrader内拥有更有组织的SMC图表布局
该指标可根据交易者偏好的执行风格,在多个符号和时间框架中使用。
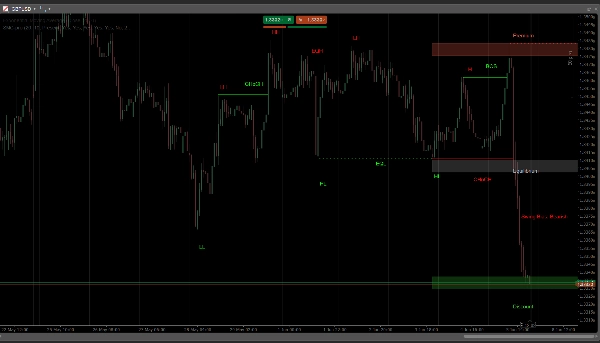
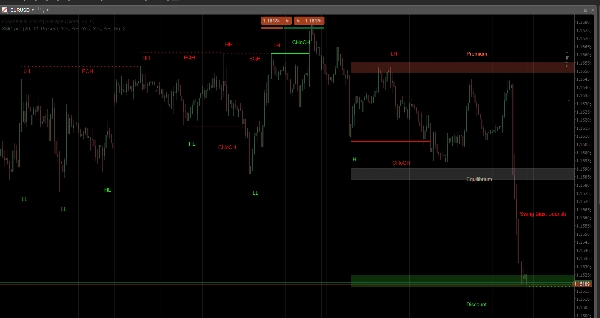
视觉结构与图表工作流程
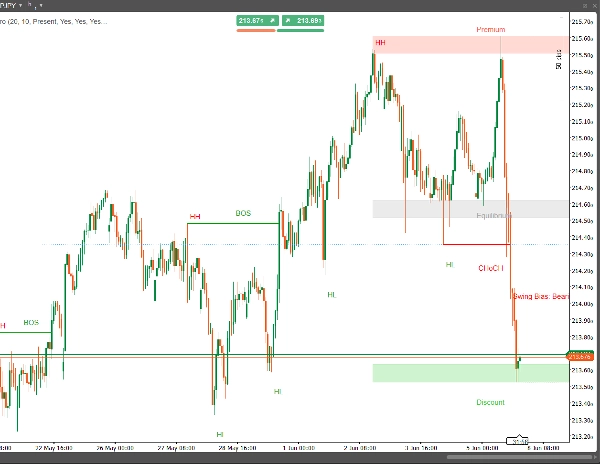
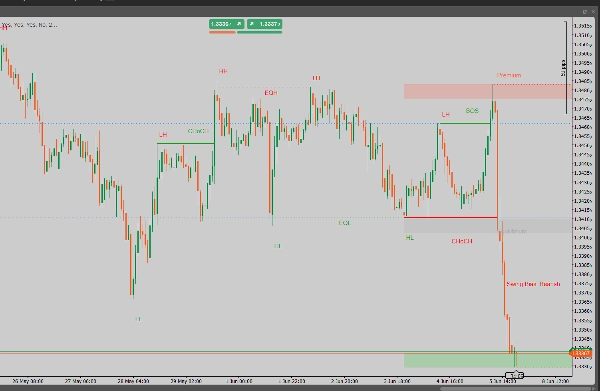
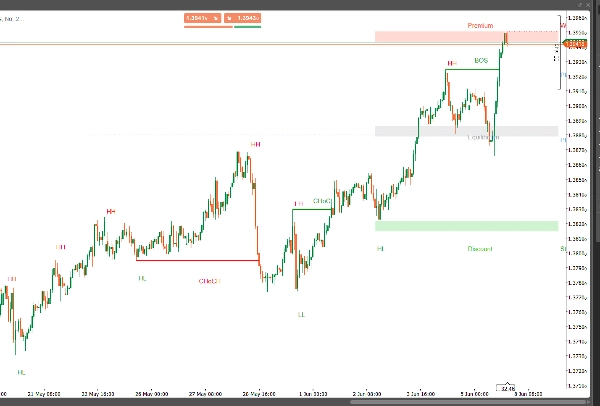
该指标直接在图表上绘制重要的市场信息,以便实时解读结构:
- 摆动标签显示市场如何从高点向低点发展
- BOS和CHoCH标记突出结构确认和变化
- 等高和等低帮助识别可能的流动性池
- 公平价值缺口显示可能吸引价格回访的不平衡区域
- 之前更高时间框架的高低点增加外部背景
- 溢价和折扣区域帮助定义当前区间内的价值区域
- 强弱水平帮助框定可能的压力点
结果是一个更易读的图表,支持快速分析,同时不剥夺交易者的自由裁量权。
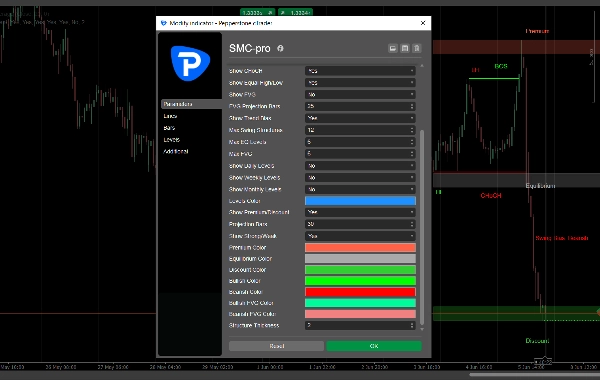
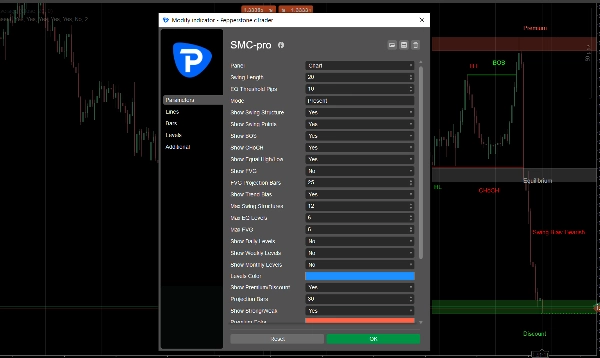
灵活配置
Smart Money Concepts Pro v5.1 包含多种设置,交易者可以根据自己的风格调整显示:
- 可调摆动长度
- 历史或当前显示模式
- 可选的摆动结构和摆动点标签
- BOS、CHoCH、等高/等低、FVG 和趋势偏向的切换控制
- 日线、周线和月线水平的可见性控制
- 区域和水平的可配置投影距离
- 结构、等水平和公平价值缺口的可调限制
- 所有主要视觉元素的自定义颜色设置
这使得该指标既适用于极简图表布局,也适用于更详细的结构工作流程。
摘要
This tool helps traders quickly identify directional structure, liquidity targets, and reaction areas without automating trade decisions. It supports configurable display options such as adjustable swing length, toggle controls for structural elements, and customizable colors, allowing users to tailor the chart layout to their preferred analysis style. The indicator is suitable for multiple symbols and timeframes, enhancing chart organization and supporting informed discretionary trading based on market structure and liquidity concepts.