
Market Entropy
Indikator
107 unduhan
Versi 1.0, Aug 2025
Windows, Mac
Sejak 26/05/2025
388.58M
Volume trading
60.75K
Pip dimenangkan
15
Penjualan
1.41K
Instal gratis
Deskripsi
Market Entropy adalah indikator ganda (osilator + overlay harga opsional) yang mengukur organisasi pasar dan menandai pergeseran rezim di seluruh Order → Transition → Chaos. Ini menambahkan garis kedua, Trendness (DC), untuk memisahkan tren sejati dari penyempitan volatilitas.
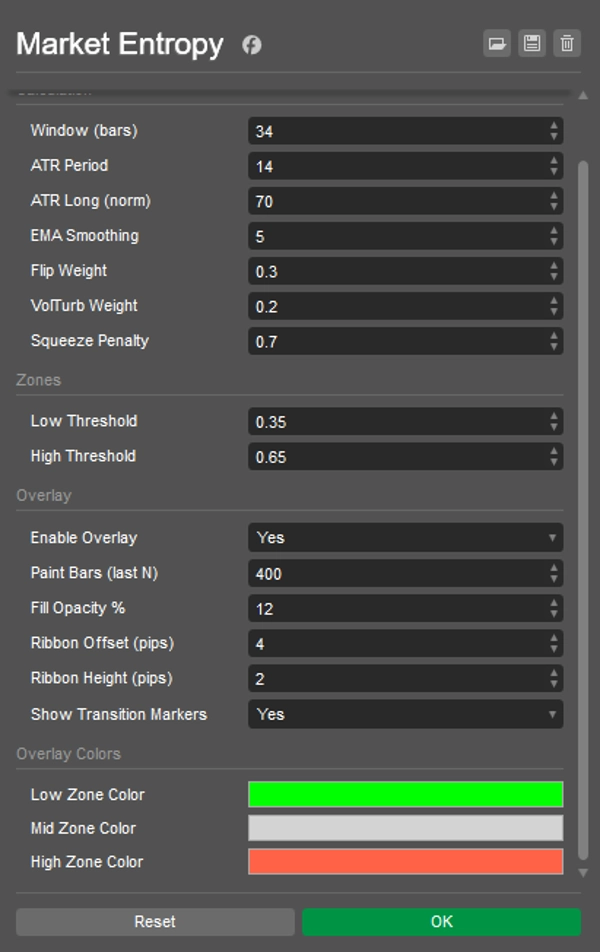
Cara kerjanya:
- Hanya menggunakan komponen OHLCV: DC (konsistensi arah), FlipRate (perubahan tanda), Volatility_n (ATR/ATRlong), VolumeTurb (deviasi standar dari ΔVolume).
- Entropi mentah:
E0 = 0.5*(1-DC) + 0.3*(FlipRate*VolN) + 0.2*VolumeTurb). - Istilah anti-squeeze menurunkan E selama kompresi ATR → Entropi akhir ∈ [0..1] dengan perataan EMA.
- Penanda:
-
- CRYSTAL — menyeberang di bawah LowThr (munculnya keteraturan: tren atau penyempitan pra-break).
- DISSOLVE — menyeberang di atas HighThr (keteraturan pecah: kekacauan/peluruhan tren).
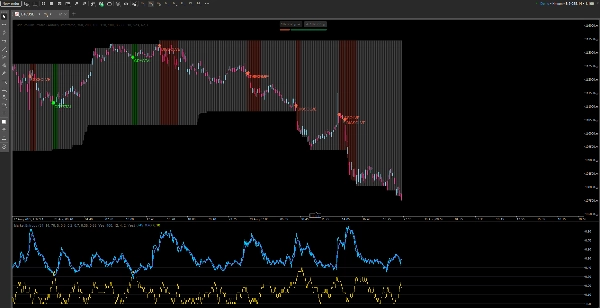
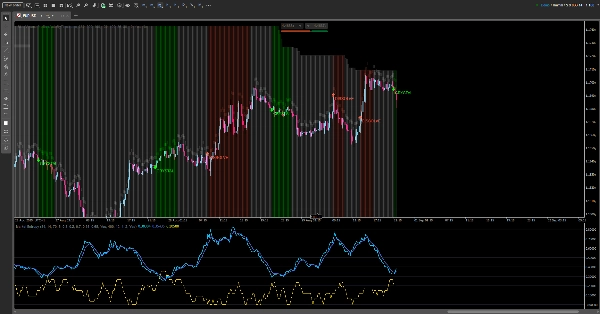
Apa yang Anda lihat:
- Di panel: Entropy, Entropy(EMA), Trendness (DC), ambang batas Low/High, latar belakang zona.
- Di grafik (dapat diaktifkan/dinonaktifkan): batang berwarna status, pita tipis di atas puncak, dan penanda CRYSTAL/DISSOLVE.
Panduan membaca:
- E < LowThr → Order:
-
- dengan DC tinggi → tren yang terorganisir;
- dengan ATR rendah → penyempitan (harapkan breakout).
- LowThr…HighThr → Transition: struktur terbentuk; tunggu resolusi.
- E > HighThr → Chaos: ketidakpastian / tren melemah; hindari entri kelanjutan yang naif.
Playbook:
- Penyempitan → CRYSTAL → Break/Retest — perdagangkan breakout.
- Tren → DISSOLVE — kurangi posisi atau perketat risiko.
Ringkasan
Profil indikator
Ulasan pelanggan
0.0
Ulasan: 0
Ulasan pelanggan
Belum ada ulasan untuk produk ini. Sudah mencobanya? Jadilah pemberi ulasan pertama!
Diskusi
Pertanyaan umum
Produk-produk yang tersedia melalui cTrader Store, termasuk bot trading, indikator, dan plugin, disediakan oleh pengembang pihak ketiga serta hanya ditujukan untuk akses teknis dan informasi. cTrader Store bukan broker dan tidak menyediakan saran investasi, rekomendasi pribadi, atau jaminan apa pun tentang kinerja di masa mendatang.


Harga
Sejak 26/05/2025
388.58M
Volume trading
60.75K
Pip dimenangkan
15
Penjualan
1.41K
Instal gratis