

Mô tả
🚀 Risk Appetite & Directional Bias ULTRA (cTrader) là một chỉ báo chế độ thị trường chuyên nghiệp được thiết kế để đo lường Risk-On / Trung lập / Risk-Off và chuyển đổi chúng thành một định hướng rõ ràng, có thể hành động. Thay vì dựa vào một thị trường duy nhất, nó so sánh hai công cụ (một “đại diện rủi ro” và một “chuẩn mực”) để xây dựng một Điểm Rủi Ro thời gian thực (0–100), làm nổi bật các chuyển đổi chế độ, và tóm tắt mọi thứ thông qua một bảng điều khiển hiển thị trên biểu đồ.
🔧 Ý nghĩa của hai tham số đầu tiên (và tại sao chúng quan trọng)
🟠 Ký hiệu Tài sản Rủi ro (BTC)
Đây là đại diện rủi ro — công cụ được sử dụng như một “nhiệt kế khẩu vị rủi ro.” Nó được gán nhãn “BTC” vì khái niệm gốc sử dụng Bitcoin như một đại diện rủi ro toàn cầu, nhưng bạn không bắt buộc phải sử dụng Bitcoin. Bạn có thể đặt nó thành bất kỳ tài sản nào đại diện tốt cho tâm lý rủi ro (ví dụ: BTC, NASDAQ/US100, các chỉ số beta cao, v.v.).
🔵 Ký hiệu Chuẩn mực (SP/US500)
Đây là thị trường tham chiếu (chuẩn mực) mà bạn muốn theo dõi để biết xu hướng vĩ mô. Thông thường là US500/SPX500, nhưng có thể là bất kỳ công cụ nào bạn coi là “động lực bối cảnh” chính của bạn.
✅ Tóm lại:
- Tài sản Rủi ro = cảm biến tâm lý (nguồn khẩu vị rủi ro)
- Chuẩn mực = thị trường tham chiếu mà bạn muốn xu hướng phản ánh
❓ Tôi có phải sử dụng nó trên Bitcoin không?
Không. Bạn có thể sử dụng chỉ báo theo nhiều cách khác nhau tùy theo mục tiêu của bạn:
✅ A) Risk-On/Risk-Off “cổ điển” vĩ mô (được khuyến nghị)
- Tài sản Rủi ro: BTCUSD
- Chuẩn mực: US500 / SPX500
Điều này cung cấp cái nhìn rõ ràng về các chế độ rủi ro toàn cầu.
✅ B) Giao dịch Bitcoin với bối cảnh vĩ mô
- Tài sản Rủi ro: BTCUSD
- Chuẩn mực: US500 (hoặc tham chiếu vĩ mô khác)
Điều này giúp bạn hiểu khi nào điều kiện vĩ mô hỗ trợ hoặc phản đối BTC.
✅ C) Mối quan hệ đa tài sản / thị trường tùy chỉnh
- Tài sản Rủi ro: BTC hoặc US100
- Chuẩn mực: thị trường bạn muốn lọc (GER40, XAUUSD, v.v.)
Điều này biến chỉ báo thành một “động cơ tâm lý” linh hoạt.
⚙️ Cách hoạt động (logic cốt lõi)
Mô hình tính toán các yếu tố sau trên cả hai ký hiệu:
📈 Lợi nhuận (%) (tùy chọn logarithmic để ổn định hơn)
📊 Biến động (độ lệch chuẩn trong khoảng thời gian chọn)
🔗 Tương quan lăn giữa hai chuỗi lợi nhuận
🎛️ Trọng số động điều chỉnh ảnh hưởng của đại diện rủi ro dựa trên:
- độ mạnh tương quan
- biến động tương đối
Điều này tạo ra một tín hiệu Thay đổi Điều chỉnh như sau:
- Làm mượt bằng EMA
- chuẩn hóa thành Điểm Rủi Ro 0–100
📊 Cách đọc nó (các tín hiệu quan trọng nhất)
🎯 Điểm Rủi Ro (0–100) là la bàn chính của bạn:
🟢 Risk-On (điểm trên ngưỡng trên, ví dụ, > 60)
→ khẩu vị rủi ro mạnh, môi trường thường ưu tiên tài sản động lực/rủi ro
🔵 Trung lập (giữa ngưỡng dưới và trên, ví dụ, 40–60)
→ chuyển tiếp / dao động / tín hiệu hỗn hợp, nên lọc
🔴 Risk-Off (điểm dưới ngưỡng dưới, ví dụ, < 40)
→ môi trường phòng thủ, mức độ thận trọng cao hơn, rủi ro giảm giá thường tăng
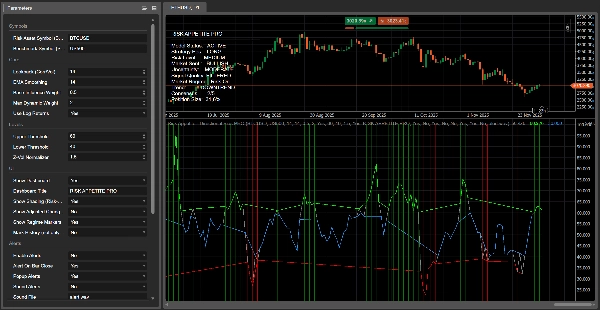
🔴 Tại sao đường màu đỏ “bị ngắt” (và ý nghĩa của nó)
Trong phiên bản ULTRA này, việc trực quan hóa là có chủ ý và “dựa trên chế độ”:
- Một đường cơ sở liên tục (màu xám) luôn hiển thị
- Các lớp phủ màu chỉ xuất hiện trong chế độ tương ứng:
-
- Lớp phủ đỏ chỉ trong Risk-Off
- Lớp phủ xanh lá chỉ trong Risk-On
- Lớp phủ xanh dương trong Trung lập
Vì vậy, khi thị trường rời khỏi Risk-Off và chuyển sang Trung lập (hoặc Risk-On), lớp phủ đỏ trở nên trống (NaN) và cTrader ngừng vẽ nó — đây là lý do nó trông như bị “gián đoạn.” ✅
📌 Quan trọng: điều này không tự động có nghĩa là xu hướng giảm đã “kết thúc.”
Nó có nghĩa là mô hình không còn phát hiện điều kiện Risk-Off mạnh mẽ, được xác nhận, vì vậy lợi thế giảm giá giảm và thị trường có khả năng đang trong giai đoạn chuyển tiếp.
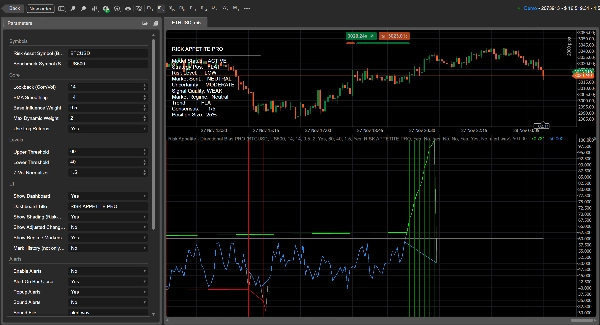
🖥️ Mục đích của hiển thị trên biểu đồ (bảng điều khiển) — giải thích từng dòng
Bảng điều khiển là bảng quyết định thời gian thực của bạn. Nó tóm tắt chế độ, độ tin cậy và hướng dẫn chiến thuật để bạn không cần phải đoán chỉ qua đường biểu đồ.
✅ Trạng thái Mô hình
Hiển thị liệu mô hình có chạy đúng không.
- ACTIVE = dữ liệu hợp lệ có sẵn và tính toán đúng
- NO DATA = thiếu dữ liệu ký hiệu, tên ký hiệu sai, hoặc không đủ lịch sử/đồng bộ thời gian
🎯 Vị trí Chiến lược (Strategy Pos)
Một tư thế đề xuất dựa trên chế độ:
- LONG = Risk-On
- SHORT = Risk-Off
- FLAT = Trung lập
⚠️ Mức Độ Rủi Ro
Một thước đo cường độ rủi ro dựa trên biến động thị trường và sự không chắc chắn.
- RẤT THẤP / THẤP = điều kiện ổn định hơn
- TRUNG BÌNH = bình thường
- CAO / RẤT CAO = nhiều nhiễu hơn, rủi ro dao động cao hơn; giảm kích thước hoặc yêu cầu xác nhận mạnh hơn
🧠 Tâm lý Thị trường
Một tông hướng định hướng dựa trên mức điểm:
- TĂNG GIÁ / GIẢM GIÁ / TRUNG LẬP
🌫️ Sự Không chắc chắn
Hiển thị mức độ “rõ ràng” của mô hình. Nó tăng lên khi:
- tương quan yếu đi, hoặc
- biến động tăng (môi trường không ổn định hơn)
Các mức: THẤP / TRUNG BÌNH / CAO
🧪 Chất lượng Tín hiệu
Một đánh giá kết hợp dựa trên:
- độ mạnh tín hiệu (khoảng cách từ 50)
- mức độ không chắc chắn
Kết quả: MẠNH / ĐÃ LỌC / YẾU
🔥 Chế độ Thị trường
Phân loại chính:
- Risk-On / Trung lập / Risk-Off
Đây là trạng thái chế độ cốt lõi điều khiển các lớp phủ màu, bóng mờ và xu hướng vị trí.
📉 Xu hướng
Hướng ngắn hạn của điểm số (độ dốc):
- TĂNG = khẩu vị rủi ro tăng
- GIẢM = khẩu vị rủi ro giảm
- ĐỨNG YÊN = đi ngang / động lực thấp
🗳️ Đồng thuận (X/5)
Một điểm số căn chỉnh đơn giản đếm có bao nhiêu điều kiện chính đồng thuận (hướng, độ dốc, căn chỉnh tương quan, v.v.).
Cao hơn = môi trường sạch hơn, nhất quán hơn.
📏 Kích thước Vị trí
Một tỷ lệ phơi bày đề xuất dựa trên độ mạnh tín hiệu và sự không chắc chắn:
- mạnh & không chắc chắn thấp → đề xuất kích thước lớn hơn
- yếu hoặc không chắc chắn → đề xuất kích thước nhỏ hơn
🧭 Ưu điểm đa khung thời gian (rất mạnh trong thực tế)
Khi bạn phân tích cùng một thị trường trên nhiều khung thời gian, chỉ báo cập nhật và căn chỉnh lại theo từng khung thời gian. Điều này giúp dễ dàng phát hiện:
✅ Căn chỉnh khung thời gian (tín hiệu mạnh hơn)
✅ Xung đột khung thời gian (thường là điều kiện trung lập/dao động hơn)
Khung thời gian cao hơn xác định chế độ vĩ mô, khung thời gian thấp hơn giúp định thời điểm vào lệnh trong chế độ đó.
📌 Các dấu hiệu, cảnh báo & thông báo (tính năng ULTRA)
✨ Dấu hiệu chế độ hiển thị trên biểu đồ khi chế độ thay đổi:
- Risk-On ↔ Trung lập ↔ Risk-Off
Điều này làm cho các chuyển đổi trở nên dễ thấy ngay lập tức.
🔔 Cảnh báo & thông báo có thể được bật để bạn nhận được:
- cảnh báo bật lên (và âm thanh tùy chọn)
- cảnh báo khi đóng nến (khuyến nghị để tránh kích hoạt sai khi nến đang hình thành)
💬 Tham gia cộng đồng của chúng tôi (tối ưu hóa + cài đặt sẵn + công cụ)
Muốn có hiệu suất tốt nhất từ chỉ báo này? Tham gia Discord của chúng tôi để:
✅ tối ưu tham số cho các ký hiệu của nhà môi giới bạn
✅ cài đặt sẵn sẵn sàng sử dụng (Crypto / Chỉ số / FX)
✅ hướng dẫn thiết lập đa khung thời gian
✅ công cụ nâng cao và cập nhật cải thiện lọc tín hiệu và chất lượng thực thi
Tóm tắt
Đánh giá của khách hàng
5 | 100 % | |
4 | 0 % | |
3 | 0 % | |
2 | 0 % | |
1 | 0 % |


![Logo "[Stellar Strategies] MARSI Signal Plotter"](https://cdn.ctrader.com/image/webp/7b2b8da6-8f8e-4646-8d4a-4710c516c01e_25567)


![Logo "[Hamster-Coder] Moving Average MTF"](https://cdn.ctrader.com/image/webp/b11b98b1-194d-4b8e-b00e-d611826ad159_31226)


![Logo "[CB] Pivot Points Pro"](https://cdn.ctrader.com/image/webp/43463c82-67b0-4f10-a4ba-901bba091d81_32594)


