present
注册即可在首次购物时获得 $50 优惠
Trading product for TIME and DATE ON CHART 指标 Drawdown Monitor Key Levels, image 1
TIME and DATE ON CHART
指标
版本 1.0, May 2026
Windows 版、Mac 版
4.2
评价:4
Trading product for TIME and DATE ON CHART 指标 Drawdown Monitor Key Levels, image 2
Trading product for TIME and DATE ON CHART 指标 Drawdown Monitor Key Levels, image 3
Trading product for TIME and DATE ON CHART 指标 Drawdown Monitor Key Levels, image 4
Trading product for TIME and DATE ON CHART 指标 Drawdown Monitor Key Levels, image 5
82.77M
交易量
50.19K
盈利点数
6
销售
468
免费安装

说明

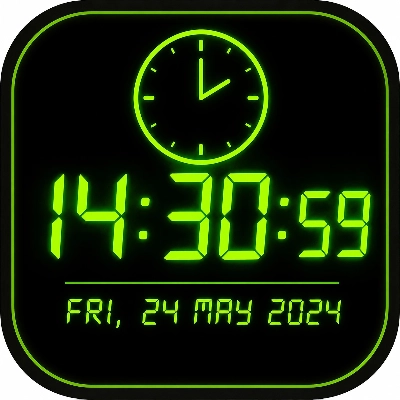
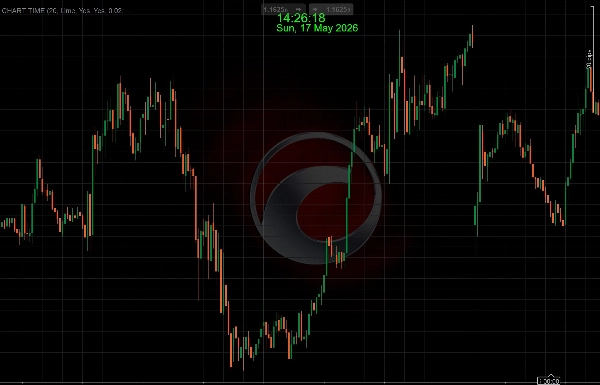
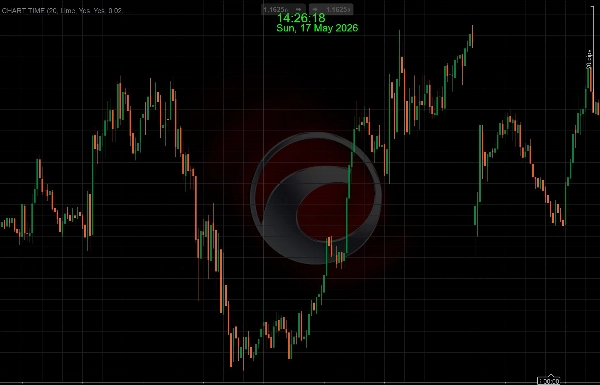
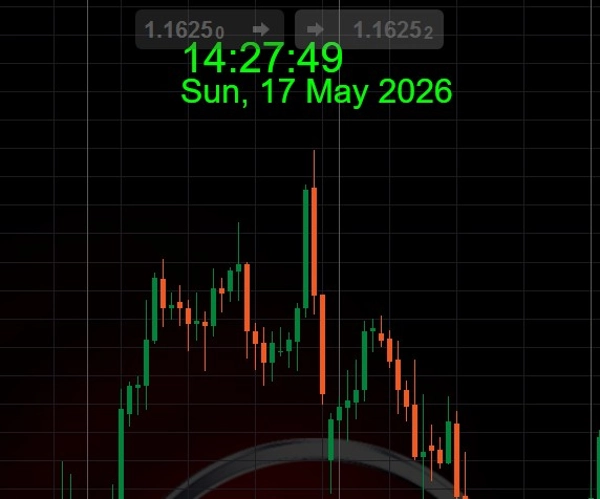
数字时钟叠加 是一个简单的 cAlgo 指标,直接在交易图表上显示实时的逐秒时钟和可选日期。它不分析任何市场数据,也不生成任何信号——它的唯一任务是显示当前的本地系统时间。

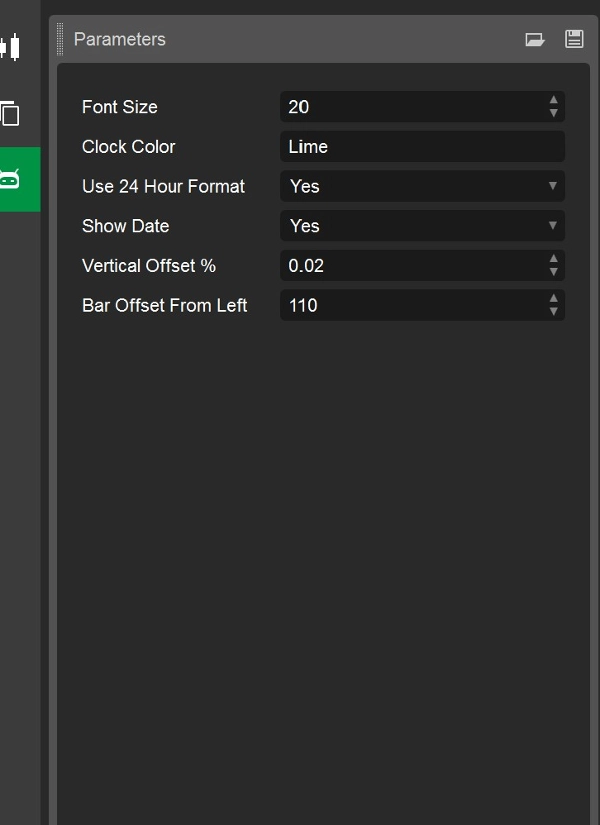
外观和位置可以通过字体大小、颜色和偏移设置完全自定义。它适合日内交易者、剥头皮交易者和需要精确且始终可见时间参考的新闻交易者,无需离开平台——特别适用于交易时段计时、新闻事件倒计时和手动交易记录。

摘要

AI 摘要
TIME and DATE ON CHART is a cAlgo indicator that overlays a live digital clock on trading charts, displaying the current local system time with second-by-second updates. It can optionally show the date as well. The indicator does not analyze market data or generate trading signals; its sole function is to provide a precise, always-visible time reference directly within the trading platform. Users can customize the clock’s appearance and position by adjusting font size, color, and screen offset. This tool is particularly useful for day traders, scalpers, and news traders who require accurate timing for session tracking, news event countdowns, and manual trade logging without switching away from their charts.
指标配置
指标分类
模式
输出类型
可视化
数据要求
外部数据
支持的信号
时段开盘区间

讨论

客户评价

4.2
评价:4
5
25 %
4
75 %
3
0 %
2
0 %
1
0 %
客户评价
May 22, 2026
TIME and DATE ON CHART is a lightweight utility indicator that does exactly what it promises: displaying a clean live clock and date directly on the chart. It is simple, stable, highly readable, and useful for session trading, news timing, and manual execution workflows. A practical overlay tool for traders who prefer having visible time references inside cTrader.
May 22, 2026
Not perfect, but the workflow felt cleaner. It works better with a written plan.
May 22, 2026
the signal still needs a chart check, no surprise there. It needs a few bad trades in the sample too.
May 18, 2026
the small win here is the setup needs a better reason to exist, and ugly trades need to be in the sample too.

常见问答

Drawdown Monitor
Key Levels
AI-assisted
Inducement
Market Structure
Supply & Demand
Risk Dashboard
cTrader Store 提供的所有产品,包括交易机器人、指标和插件,均由第三方开发者提供,仅供信息参考和技术访问之用。cTrader Store 并非经纪商,不提供投资建议、个人推荐或任何未来业绩保证。

该作者的其他作品
cBot
XAUUSD
Commodities
Need Trial Version of Rocket Drive? Get it here
指标
EMA
RSI
+5
MACD Colour Histogram with 11 Moving Average Types, Multi-timeframe confirmation and Sound Signal Alert.
指标
Market Structure
An indicator That tracks the four major forex sessions — Sydney, Tokyo, London, and New York, with DST
cBot
AI
XAUUSD
+1
An AI infused Self Gold Recalibration Robot that uses custom indicator with 4 Take Profit features to maximize profit.
指标
BOS
Key Levels
+2
Realtime Trade Adviser will tell you When to BUY and When to SELL. A real time Trade Prompter
"ZIG ZAG" 标识
评分最高
4.4
(5)
$19
/
$20
指标
Flag
Key Levels
+5
Zig Zag filters out minor price noise and connects only the most significant swing and lows for key turning points.
指标
ATR
Fibonacci
+1
Trading Clock Pro: An all-in-one market timing dashboard designed to help traders understand the market at one Spot.

猜您喜欢

指标
Forex
BTCUSD
+4
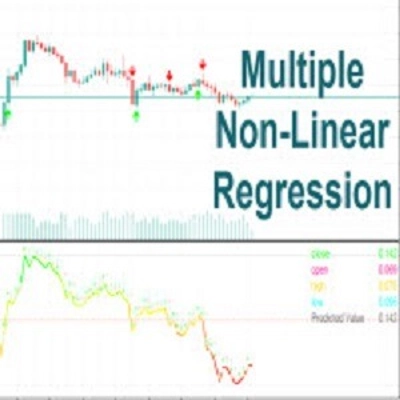
This indicator is designed to perform multiple non-linear regression analysis using four independent variables.
指标
ATR
EMA
+5
Candle timer with live profit tracking on chart – displays pips, currency value, and percentage in real time.
指标
AI
Grid
+17
Clean 3D, Sleek Candles for Trend Patterns.
"crossover 1" 标识
评分最高
4.2
(5)
$19
/
$29
指标
AI
Grid
+10
Crossover Buy and Sell Alerts and signals
指标
ATR
Forex
+5
🚀 Buy and sell signals 📈📉 only when three independent engines agree simultaneously.
指标
RSI
Prop
+14
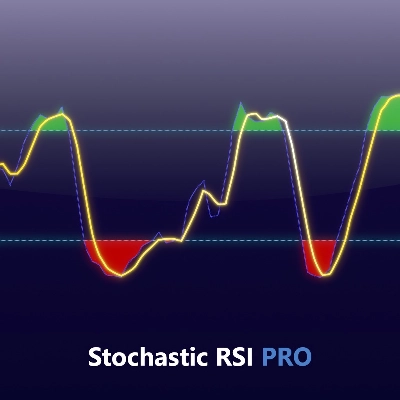
Unlock Stochastic RSI PRO in cTrader! Overlay RSI, highlight zones, and identify divergences with customizable settings.
指标
Prop
Forex
+4
It draws Pivot Levels on the chart.
指标
ATR
Channel
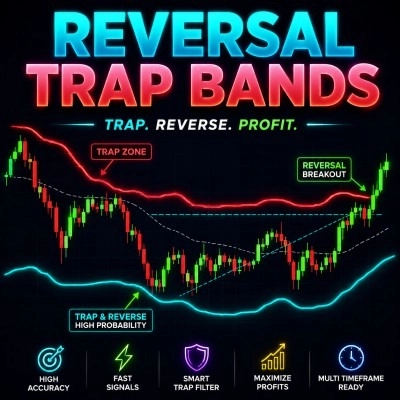
Reversal Trap Probability Bands plots a dynamic volatility envelope around price & automatically detects "trap" reversal
指标
ATR
RSI
+1
Super Trend Rsi ,ATR + trend change distance + dynamic Alpha, divergence/convergence
指标
ADX
ATR
+5
Configure, simulate, and analyze trading strategies with custom filters, multi-target exits, and detailed performance me
指标
Signal
USDJPY
See USD demand in one line—Composite OBV fuses six major FX pairs into a clear momentum gauge.
指标
VWAP
Volume
+5
Multi VWAP. Three timeframes. One clean chart. Your Essential Trading Tool.
指标
ATR
RSI
+14
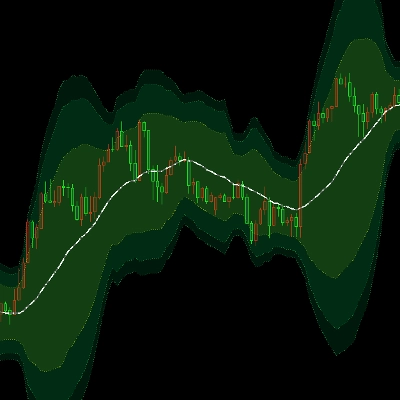
A metric that can set 1 to 3 groups of Bollinger Bands
"KANDIKA HEAT MAP" 标识
评分最高
4.6
(5)
$19
指标
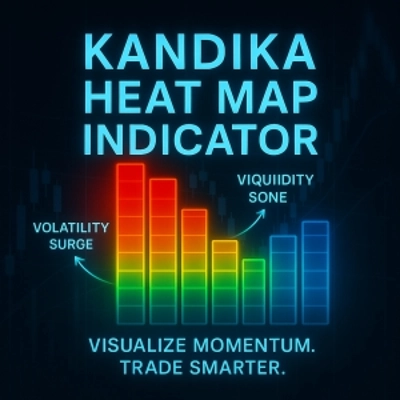
Color-Based Market Pressure & Volatility Visualizer The Kandika Heatmap Indicator
指标
ZigZag
Indices
+2
Auto Trendlines, Fibonacci, Pitchfork and Patterns from non‑repainting pivots. One‑click Presets, targeted Alerts, and a
指标
SMC
Prop
+14
BoS ChoCH Pro,Strict Mode,False Breakout Filter,Average hit rate: 72-78%
指标
ATR
Volume
+4
This allows traders to see not just the trend, but whether the momentum itself is overextended.
指标
ATR
Prop
+14
Optimize exits with Chandelier Exit! Visualize stop-loss points dynamically for improved trading precision and safety.

价格

82.77M
交易量
50.19K
盈利点数
6
销售
468
免费安装