
Описание
🚀 Более 10 000 трейдеров уже используют наши ЛУЧШИЕ индикаторы🏆
Узнайте, почему профессионалы выбирают нас – самые мощные инструменты на cTrader (индикаторы, алгоритмы и cBots) ждут вас.
👉 Получите все наши ЛУЧШИЕ системы здесь:
_______________________________________________
📌 Индикаторы структуры рынка
· ✅ AdvancedMarket Structure: Bos, Choch, SwinLevels, Order Blocks, Market Structure& Liquidity Finder
· 🔄 Dynamic Market StructureAnalysis of Turning Points
· 🧱 Order Block
· ⚖️ Market Imbalance
· ⛓️ BOS & CHOCH
· 🧠 ICT Power of 3
_______________________________________________
🔚 Системы умного выхода
_______________________________________________
📐 Индикаторы ZigZag
· 🔍 ZigZag Price LiquidityProjection
· ➖ ZigZag
_______________________________________________
🧱 Индикаторы поддержки и сопротивления
· 🟩 SmartTrend Support &Resistance Lines
· 🧱 All Support and ResistanceLevels
_______________________________________________
📊 Индикаторы тренда и каналов
· 📊 Supertrend
_______________________________________________
💧 Инструменты объема и ликвидности
_______________________________________________
⚡ Индикаторы импульса и RSI
· 🔎 Multi-Level Candle Bias
Tracker
_______________________________________________
🔮 Инструменты прогнозирования и проекции
· 📐 Prediction Based on Linreg& ATR
· 📏 Fibonacci Linear RegressionMulti-timeframe
· 📈 Volume-Powered Market Flow Projector
________________________________________________________________________________________________________
________________________________________________________________________________________________________
Кривая Безье паттерна McDonalds 🍟
Для чего это? 🤔
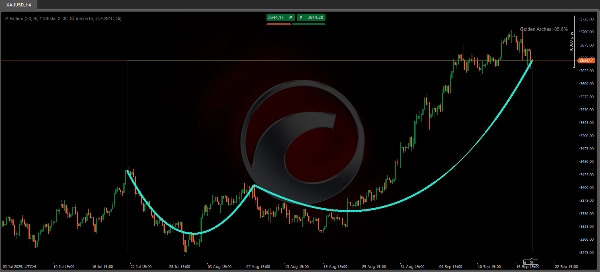
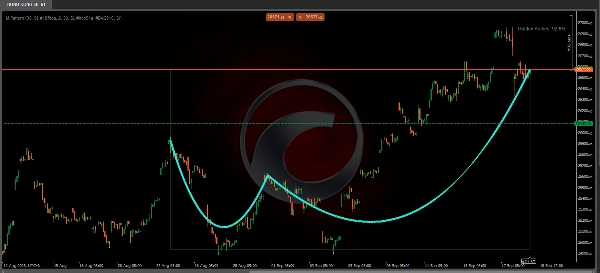
Индикатор "Кривая Безье паттерна McDonalds" предназначен для выявления и визуализации паттернов разворота цены с помощью кривых Безье. Его основная задача — обнаруживать рыночные структуры, напоминающие дуги (похожие на "M" или "W") на графиках, что может указывать на возможные изменения тренда 🎯. Кроме того, он включает систему оценки для оценки качества обнаруженного паттерна.
Как это работает? ⚙️
- Обнаружение пивотов:
Индикатор анализирует период обратного просмотра (определяемый параметром "Lookback Period") для выявления локальных максимумов и минимумов (пивотов). Они отмечаются кругами на графике: ⚪ - Кривые Безье:
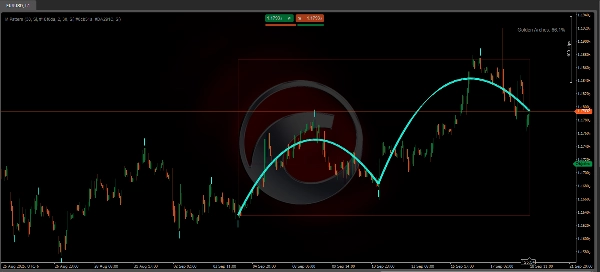
После обнаружения как минимум 5 пивотов индикатор рисует две дуги с помощью кривых Безье, соединяющие эти точки. Эти дуги призваны сгладить переход между пивотами, формируя визуальную структуру, похожую на двойные арки ("Золотые арки") 🏛️. - Окрашенная зона:
Если включено, рисуется область между первым и последним пивотом. Цвет этой зоны зависит от направления паттерна: -
- 🟢 Зеленый: бычий тренд (если последний пивот выше).
- 🔴 Красный: медвежий тренд (если последний пивот ниже).
- Оценка паттерна:
Вычисляется процент, отражающий симметрию и качество дуг. Более высокий балл указывает на лучше определенный паттерн.
Происходит ли перерисовка (Replotting)? 🔄
Да, этот индикатор перерисовывается. Это означает, что его рисунки и обнаружения могут изменяться ретроспективно по мере поступления новых данных о цене. Это связано с тем, что идентификация этих точек перегиба основана на наблюдении определенного количества баров после формирования потенциального пивота. Следовательно, то, что кажется подтвержденной дугой в исторических данных, может быть скорректировано или исчезнуть при применении к живым графикам 📊.
Он может использоваться как вспомогательный инструмент в техническом анализе.
Как его можно использовать? 💡
- 📚 Анализ обратного тестирования:
Полезен для изучения исторических паттернов и оценки их эффективности на разных активах или таймфреймах. - 👁️ Визуальное подтверждение:
Может дополнять другие инструменты анализа (например, уровни поддержки/сопротивления или скользящие средние) для подтверждения потенциальных разворотов. - 🎓 Обучение:
Помогает распознавать рыночные структуры на основе кривых Безье, хотя его использование в реальной торговле требует дополнительной проверки.
Ограничения и рекомендации ⚠️
- Использование в реальном времени:
Поскольку индикатор перерисовывается, его не следует использовать как независимый сигнал для входа или выхода с рынка. - Оптимизация:
Настройте параметр "Lookback Period" в зависимости от актива и таймфрейма, чтобы уменьшить количество ложных сигналов. - Рыночный контекст:
Лучше всего работает на трендовых рынках и не подходит для боковых/флэтовых рынков.
Важное замечание: 🚨
Учитывая зависимость от будущих данных для подтверждения, его следует использовать преимущественно для анализа уже произошедших событий, таких как падения после открытия рынка или учебные упражнения с графиками, а не для прогнозирования или живой торговли. Хотя подход инновационный, его необходимо использовать вместе с другими индикаторами и анализом, чтобы избежать ложных сигналов из-за природы перерисовки. Он идеально подходит для исследований обратного тестирования или как образовательное дополнение в торговых стратегиях.
Сводка
This tool repaints, meaning its visualizations and detections can change retroactively as new price data arrives, so it is best used for backtesting, educational purposes, or as a complementary aid alongside other technical analysis tools. It is optimized for trending markets and requires adjustment of the lookback period to suit different assets and timeframes. The indicator supports markets including Forex (e.g., EURUSD), commodities (e.g., XAUUSD), and cryptocurrencies (e.g., BTCUSD).


