Описание
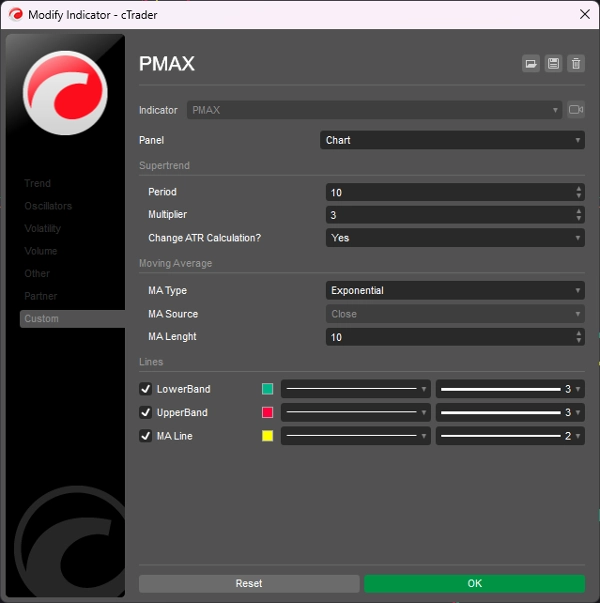
PMax (Profit Maximizer) — это совершенно новый индикатор, разработанный KivancOzbilgic в начале 2020 года.
Это комбинация двух индикаторов трейлинг-стопа;
Один из них — индикатор MOST (Moving Stop Loss) Аныля Озекши, а другой — широко известный SuperTrend на основе ATR.
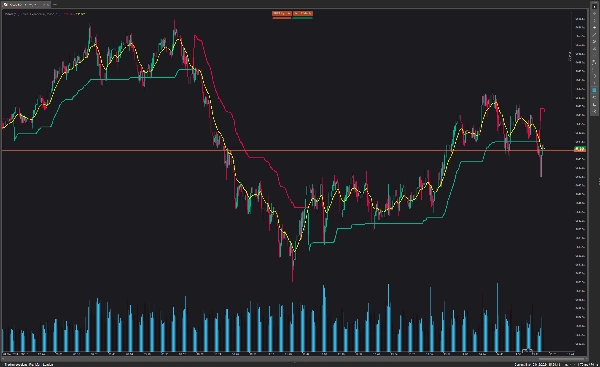
Индикаторы MOST и SuperTrend очень хороши для систем следования за трендом, но, наоборот, их эффективность невысока в боковых рыночных условиях, как и у большинства других индикаторов.
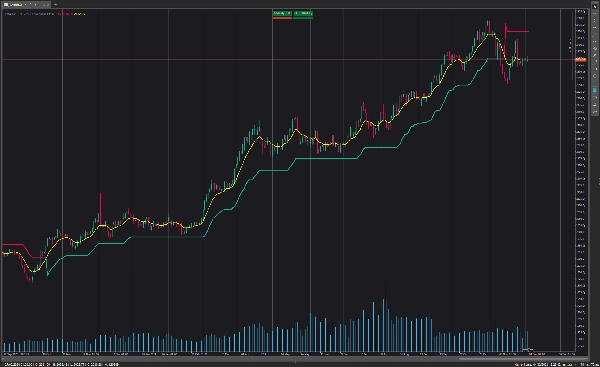
Profit Maximizer — PMax пытается решить эту проблему. PMax объединяет сильные стороны MOST (изменитель тренда на основе скользящей средней) и SuperTrend (определение цены на основе ATR) в одном индикаторе.
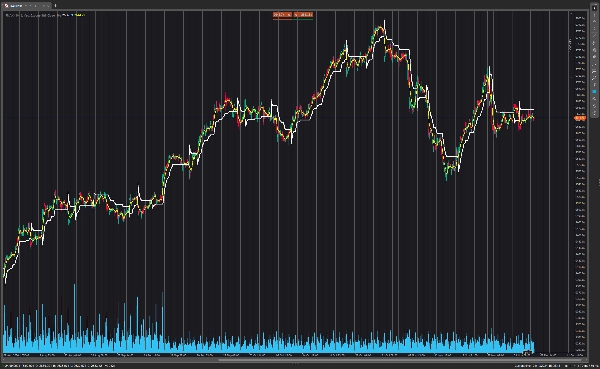
Результаты бэктеста и оптимизации PMax значительно лучше по сравнению с его предшественниками MOST и SuperTrend. Он уменьшает количество ложных сигналов в боковом движении и дает более надежные торговые сигналы.
PMax легко определяет тренд и может использоваться на любых типах рынков и инструментах. Он не перерисовывается.
Сводка
This combination enhances trend identification and reduces false signals during non-trending market phases. Backtesting and optimization show that PMax outperforms its component indicators in reliability and signal accuracy. It is designed for use across various markets and instruments and does not repaint, providing consistent signals for traders.
Отзывы покупателей
5 | 100 % | |
4 | 0 % | |
3 | 0 % | |
2 | 0 % | |
1 | 0 % |