الوصف
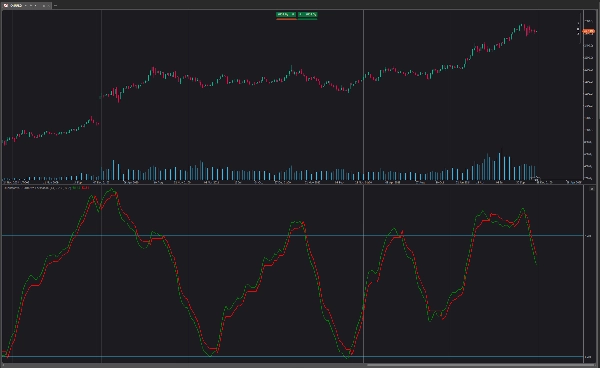
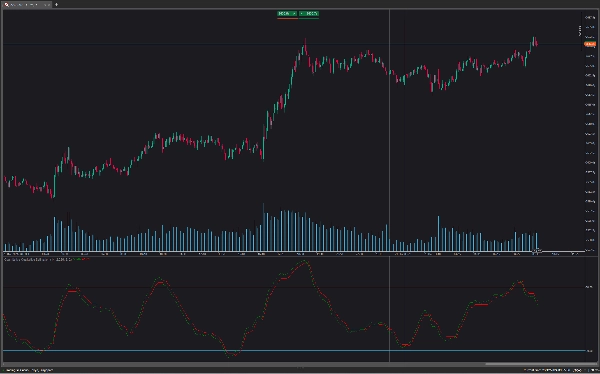
محسّن مذبذب QQE (التقدير الكمي النوعي) المرجح نسخته الأصلية من خلال وزن مؤشر RSI بناءً على المؤشرات التي يقدمها التوقف المتحرك، مما يتطلب جهدًا أكبر لحدوث تقاطع مع التوقف المتحرك. يتكون مذبذب QQE المرجح من مذبذب RSI مملس وتوقف متحرك مشتق من نفس مؤشر RSI.
يمكن استخدام المذبذب للإشارة إلى ما إذا كان السوق في حالة شراء مفرط/بيع مفرط وكذلك كإشارة مبكرة لانعكاسات الاتجاه بفضل الطبيعة القيادية لمؤشر RSI.
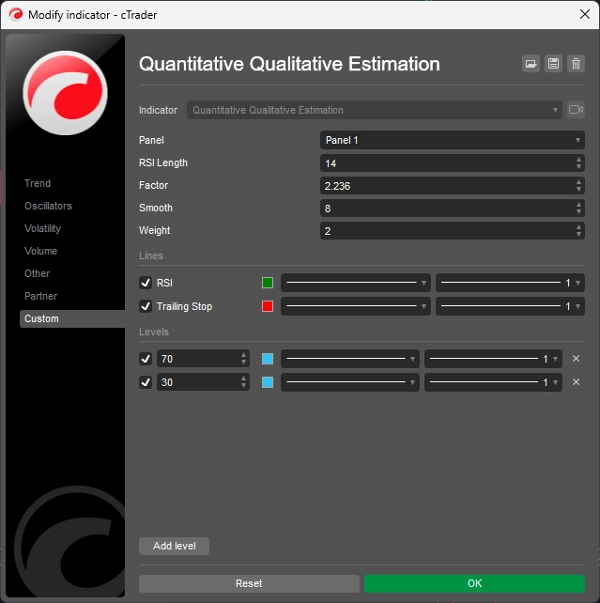
استخدام قيم Factor الأعلى سيُرجع توقفًا متحركًا طويل الأمد.
مثلما هو الحال مع مؤشر RSI العادي، يمكن أن يشير التباعد إلى انعكاس.
الوزن الإضافي سيتحكم في مقدار "الجهد" المطلوب لتقاطع التوقف المتحرك مع مؤشر RSI. على سبيل المثال، مؤشر RSI فوق التوقف المتحرك سيتطلب درجة أعلى من التغيرات السلبية في السعر لحدوث تقاطع محتمل عند استخدام أوزان أعلى.
يمكن أن يؤدي ذلك إلى أن تعطي الأوزان الأعلى نتائج أكثر دورية وأكثر سلاسة.
كيفية تغيير الإعدادات:
- الطول: طول مذبذب RSI.
- العامل: العامل المضاعف المستخدم لحساب التوقف المتحرك.
- التمليس: درجة تمليس مذبذب RSI.
- الوزن: درجة الوزن المستخدمة في حساب RSI.
الملخص
تقييمات العملاء
5 | 100 % | |
4 | 0 % | |
3 | 0 % | |
2 | 0 % | |
1 | 0 % |