
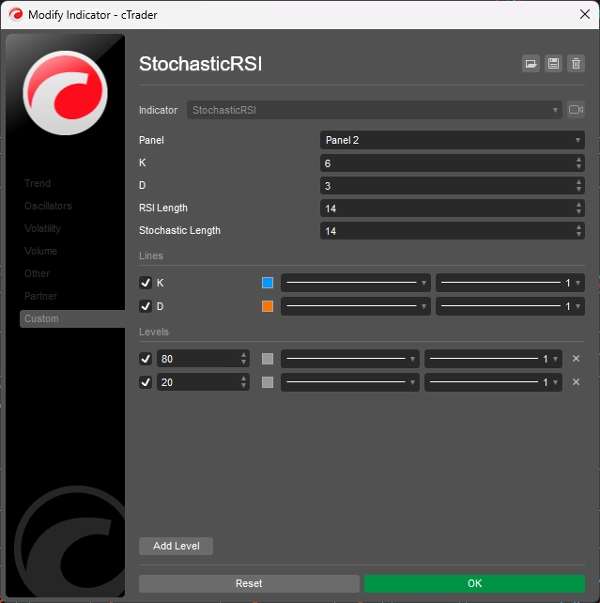
StochasticRSI
Indikator
1.16K unduhan
Versi 1.0, Nov 2024
Windows, Mac
5.0
Ulasan: 1
Deskripsi
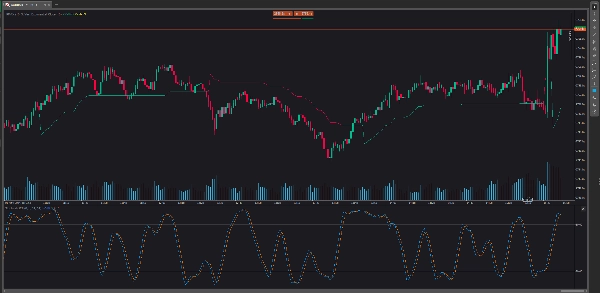
Stochastic RSI (StochRSI) adalah indikator analisis teknikal yang digunakan untuk mendukung prediksi pasar saham dengan membandingkan rentang harga suatu sekuritas dengan harga penutupannya. StochRSI unik karena fokus pada momentum pasar dan baik dalam membaca kondisi pasar yang jenuh beli dan jenuh jual. StochRSI berbeda dari indikator teknikal lainnya, seperti Relative Strength Index (RSI), karena bergerak dari harga jenuh beli ke jenuh jual lebih cepat daripada RSI.
Ringkasan
Ringkasan AI
Stochastic RSI (StochRSI) is a technical analysis indicator designed to assess market momentum by comparing a security's price range to its closing price. It is used primarily to identify overbought and oversold conditions in stock markets, providing faster signals than the traditional Relative Strength Index (RSI). Unlike RSI, StochRSI moves more rapidly between overbought and oversold levels, making it useful for traders seeking timely momentum insights. This indicator supports analysis across various indices and is categorized under momentum indicators, specifically related to RSI.
Profil indikator
Ulasan pelanggan
5.0
Ulasan: 1
5 | 100 % | |
4 | 0 % | |
3 | 0 % | |
2 | 0 % | |
1 | 0 % |
Ulasan pelanggan
July 9, 2025
Pros: Combines Stochastic Oscillator and RSI for improved overbought/oversold detection. Easy to set up, stable on all timeframes. Cons: No tooltips or alerts. Requires confirmation from trend indicators to avoid false signals. Limited customization options.
Diskusi
Pertanyaan umum
Indices
RSI
Produk-produk yang tersedia melalui cTrader Store, termasuk bot trading, indikator, dan plugin, disediakan oleh pengembang pihak ketiga serta hanya ditujukan untuk akses teknis dan informasi. cTrader Store bukan broker dan tidak menyediakan saran investasi, rekomendasi pribadi, atau jaminan apa pun tentang kinerja di masa mendatang.
Produk lain dari penulis ini


![Logo "[Hamster-Coder] Moving Average MTF"](https://cdn.ctrader.com/image/webp/b11b98b1-194d-4b8e-b00e-d611826ad159_31226)


Harga
2
Penjualan
6.9K
Instal gratis