الوصف
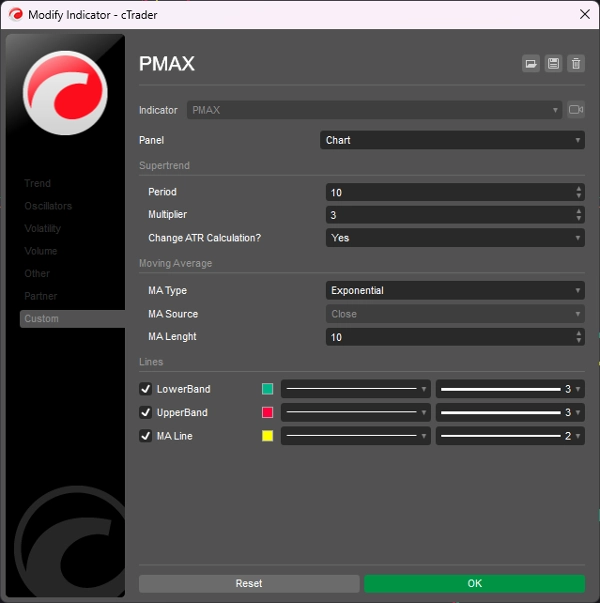
PMax (مُعظّم الأرباح) هو مؤشر جديد تمامًا تم تطويره بواسطة KivancOzbilgic في أوائل عام 2020.
إنه مزيج من مؤشرين لتحديد وقف الخسارة المتحرك؛
أحدهما هو مؤشر MOST (وقف الخسارة المتحرك) لأنيل أوزيكشي والآخر هو مؤشر SuperTrend المعروف المعتمد على ATR.
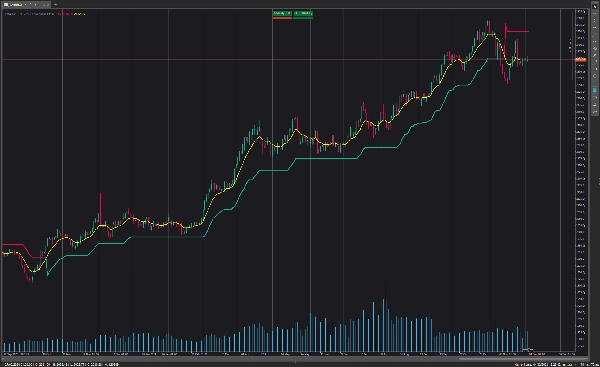
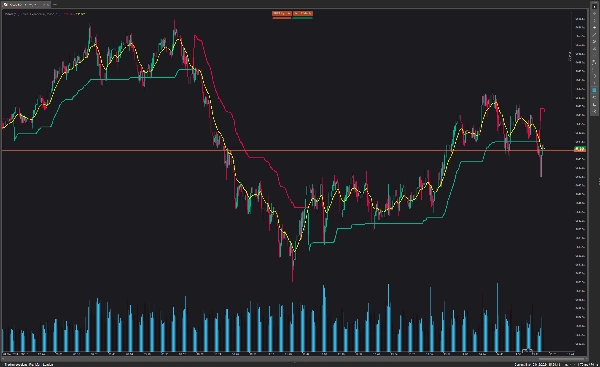
كلا من مؤشري MOST و SuperTrend جيدان جدًا في أنظمة متابعة الاتجاه، ولكن على العكس من ذلك، أداؤهما ليس جيدًا في ظروف السوق الجانبية مثل معظم المؤشرات الأخرى.
يحاول مُعظّم الأرباح - PMax حل هذه المشكلة. يجمع PMax بين الجوانب القوية لمؤشر MOST (مغير اتجاه المتوسط المتحرك) و SuperTrend (كشف السعر باستخدام ATR) في مؤشر واحد.
نتائج الاختبار الخلفي والتحسين لـ PMax أفضل بكثير عند مقارنتها بأسلافه MOST و SuperTrend. فهو يقلل من عدد الإشارات الخاطئة في الأسواق الجانبية ويعطي إشارات تداول أكثر موثوقية.
PMax سهل لتحديد الاتجاه ويمكن استخدامه في أي نوع من الأسواق والأدوات. لا يعيد الرسم.
الملخص
This combination enhances trend identification and reduces false signals during non-trending market phases. Backtesting and optimization show that PMax outperforms its component indicators in reliability and signal accuracy. It is designed for use across various markets and instruments and does not repaint, providing consistent signals for traders.
تقييمات العملاء
5 | 100 % | |
4 | 0 % | |
3 | 0 % | |
2 | 0 % | |
1 | 0 % |