
Description
Le guide complet de l'analyse du nuage Ichimoku
Histoire et contexte
L'Ichimoku Kinko Hyo (ou nuage Ichimoku) a été développé par le journaliste japonais Goichi Hosoda à la fin des années 1930. Après des années de recherche et de tests rétroactifs avec une équipe d'assistants, Hosoda a publié ses résultats en 1969. Le nom "Ichimoku Kinko Hyo" se traduit par "graphique d'équilibre en un coup d'œil", ce qui reflète son objectif : permettre aux traders d'évaluer rapidement plusieurs aspects de l'action du marché en une seule vue.
L'innovation de Hosoda était remarquable car il a créé ce système complexe des décennies avant que l'analyse informatique ne soit disponible, effectuant tous les calculs à la main. Ce qui rend le système Ichimoku unique, c'est son approche holistique, intégrant plusieurs horizons temporels et dimensions d'analyse du marché dans un cadre unifié.
Les cinq composantes du nuage Ichimoku
Le nuage Ichimoku se compose de cinq lignes distinctes, chacune fournissant des informations spécifiques :
1. Tenkan-sen (ligne de conversion)
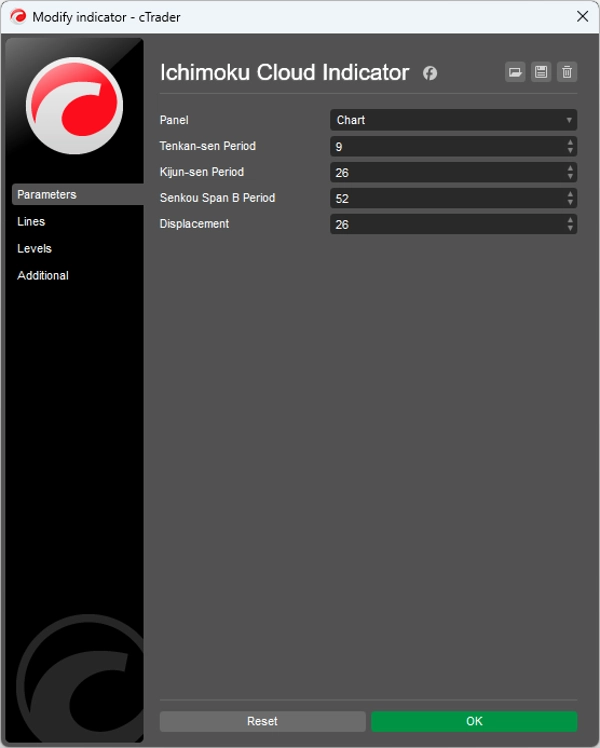
- Calcul : (Plus haut + Plus bas) / 2 pour les 9 dernières périodes
- Fonction : Représente la dynamique du marché à court terme
- Interprétation : Sert de niveau dynamique de support/résistance et d'indicateur de tendance
2. Kijun-sen (ligne de base)
- Calcul : (Plus haut + Plus bas) / 2 pour les 26 dernières périodes
- Fonction : Représente la dynamique du marché à moyen terme
- Interprétation : Sert de niveau de support/résistance plus fort et peut servir de stop suiveur
3. Senkou Span A (premier span avancé)
- Calcul : (Tenkan-sen + Kijun-sen) / 2, tracé 26 périodes en avance
- Fonction : Forme le bord avant du nuage (Kumo)
- Interprétation : Niveau projeté de support/résistance
4. Senkou Span B (second span avancé)
- Calcul : (Plus haut + Plus bas) / 2 pour les 52 dernières périodes, tracé 26 périodes en avance
- Fonction : Forme le bord arrière du nuage (Kumo)
- Interprétation : Niveau projeté de support/résistance
5. Chikou Span (span retardé)
- Calcul : Prix de clôture actuel, tracé 26 périodes en arrière
- Fonction : Confirme les tendances et identifie les retournements potentiels
- Interprétation : Lorsque au-dessus de l'action des prix, haussier ; lorsqu'en dessous, baissier
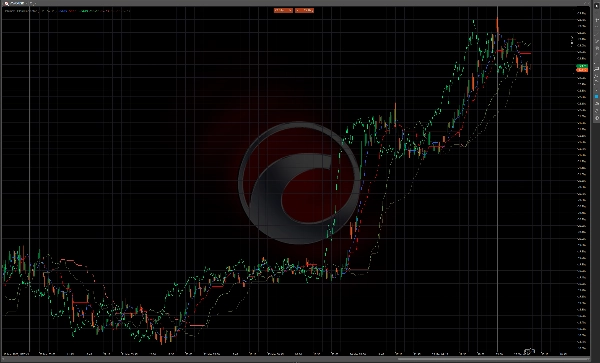
Le Kumo (nuage)
La zone entre Senkou Span A et Senkou Span B est appelée "Kumo" ou nuage. Le nuage représente des zones potentielles de support et de résistance et son épaisseur indique la volatilité du marché ainsi que la force de ces zones.
- Nuage épais : Support/résistance fort, volatilité plus élevée
- Nuage fin : Support/résistance plus faible, volatilité plus faible
- Nuage haussier : Senkou Span A au-dessus de Senkou Span B (souvent coloré en vert)
- Nuage baissier : Senkou Span B au-dessus de Senkou Span A (souvent coloré en rouge)
Règles et signaux de trading
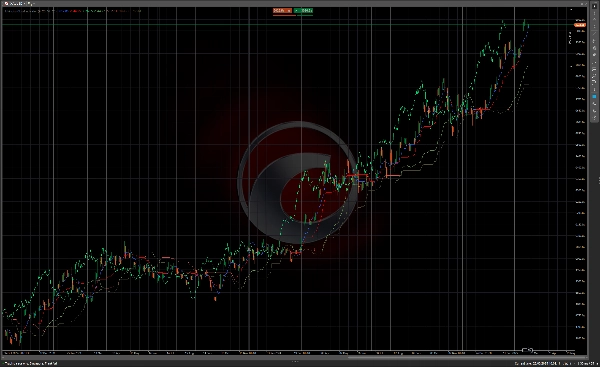
Détermination de la tendance
- Critères de tendance haussière :
-
- Le prix est au-dessus du nuage
- Le Tenkan-sen est au-dessus du Kijun-sen
- Le Chikou Span est au-dessus du prix d'il y a 26 périodes
- Le Senkou Span A est en hausse et au-dessus du Senkou Span B (nuage haussier)
- Critères de tendance baissière :
-
- Le prix est en dessous du nuage
- Le Tenkan-sen est en dessous du Kijun-sen
- Le Chikou Span est en dessous du prix d'il y a 26 périodes
- Le Senkou Span A est en baisse et en dessous du Senkou Span B (nuage baissier)
- Marché neutre/en range :
-
- Le prix est à l'intérieur du nuage
- Le Tenkan-sen et le Kijun-sen sont plats ou se croisent fréquemment
Signaux d'entrée
Signaux d'entrée haussiers
- Croisement TK (Tenkan/Kijun) :
-
- Le Tenkan-sen croise au-dessus du Kijun-sen
- Plus efficace lorsque le prix est au-dessus du nuage
- Signal plus fort lorsque le nuage est haussier
- Cassure du Kumo :
-
- Le prix casse au-dessus du nuage après avoir été en dessous ou à l'intérieur
- Signal plus fort lorsque le nuage à venir est haussier (Senkou Span A > Senkou Span B)
- Confirmation du Chikou Span :
-
- Le Chikou Span croise au-dessus du prix d'il y a 26 périodes
- Pas de résistance devant le Chikou Span
Signaux d'entrée baissiers
- Croisement TK (baissier) :
-
- Le Tenkan-sen croise en dessous du Kijun-sen
- Plus efficace lorsque le prix est en dessous du nuage
- Signal plus fort lorsque le nuage est baissier
- Cassure du Kumo (baissier) :
-
- Le prix casse en dessous du nuage après avoir été au-dessus ou à l'intérieur
- Signal plus fort lorsque le nuage à venir est baissier (Senkou Span B > Senkou Span A)
- Confirmation du Chikou Span (baissier) :
-
- Le Chikou Span croise en dessous du prix d'il y a 26 périodes
- Pas de support devant le Chikou Span
Signaux de sortie
- Renversement de tendance : Lorsque les critères pour la tendance opposée commencent à apparaître
- Croisement TK : Lorsque le Tenkan-sen croise le Kijun-sen dans la direction opposée
- Contact avec le nuage : Lorsque le prix touche le côté opposé du nuage
- Alerte Chikou Span : Lorsque le Chikou Span approche des niveaux de prix historiques
Niveaux de support et de résistance
- Support/résistance immédiat : Tenkan-sen et Kijun-sen
- Support/résistance à moyen terme : Le nuage (plus fort aux sections plates)
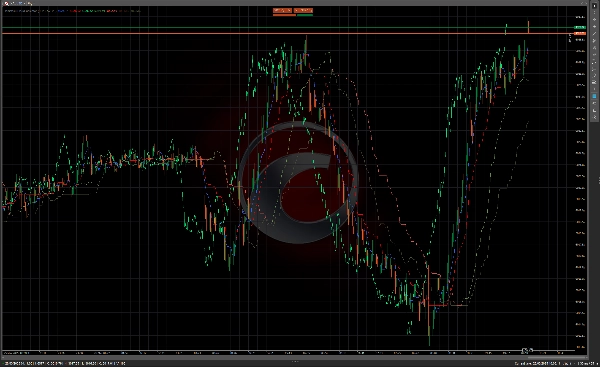
- Torsion du Kumo : Lorsque Senkou Span A et B se croisent, créant des points de retournement potentiels
Techniques avancées Ichimoku
1. Torsion du Kumo (torsion du nuage)
Une torsion du Kumo se produit lorsque Senkou Span A et B se croisent, créant un point de retournement potentiel 26 périodes dans le futur. Les traders utilisent souvent cela comme un signal d'alerte précoce pour des changements de tendance potentiels.
2. Analyse des horizons temporels
De nombreux traders Ichimoku analysent plusieurs horizons temporels :
- Horizon temporel supérieur pour la direction générale de la tendance
- Horizon temporel moyen pour les signaux d'entrée
- Horizon temporel inférieur pour un timing précis des entrées
3. Élargissement/resserrement des Senkou Span
- Élargissement du nuage : Volatilité du marché en augmentation, tendance plus forte
- Resserrement du nuage : Volatilité en baisse, affaiblissement potentiel de la tendance
4. Kumo plat (nuage plat)
Lorsque les deux Senkou Span sont parallèles, cela indique souvent une tendance forte avec des niveaux clairs de support/résistance.
Applications pratiques
Conditions de marché idéales
Le nuage Ichimoku fonctionne mieux dans les marchés en tendance et sur tous les horizons temporels. Il peut être appliqué à :
- Forex
- Actions
- Matières premières
- Cryptomonnaies
- Indices
Gestion des risques
- Utiliser le nuage comme niveau dynamique de stop-loss
- Ajuster la taille de la position en fonction de l'épaisseur du nuage (nuage plus épais = volatilité plus élevée)
- Considérer le Kijun-sen comme un stop suiveur dans les tendances fortes
Compatibilité des horizons temporels
Les réglages traditionnels (9, 26, 52) étaient basés sur la semaine de trading japonaise (qui comptait 6 jours), donc certains traders ajustent ces réglages :
- 10, 30, 60 pour les graphiques journaliers
- 20, 60, 120 pour des signaux plus conservateurs
- 7, 22, 44 pour les marchés occidentaux (semaine de trading de 5 jours)
Conclusion
Le nuage Ichimoku offre un système de trading complet qui fournit plusieurs couches d'informations sur le marché en une seule vue. Ce qui le rend puissant, ce ne sont pas seulement les signaux individuels, mais la confluence de plusieurs indicateurs travaillant ensemble. Lorsque tous les composants s'alignent, le système Ichimoku peut offrir des opportunités de trading à haute probabilité avec des paramètres de risque clairement définis.
Bien qu'il semble initialement complexe, avec de la pratique, les traders peuvent effectivement évaluer les conditions du marché "d'un coup d'œil" comme Hosoda l'avait prévu. Les composants décalés dans le temps du système offrent également une perspective unique sur la dynamique du marché, permettant aux traders de voir les niveaux potentiels de support et de résistance futurs avant qu'ils ne deviennent pertinents.
Résumé
1. Tenkan-sen (Conversion Line): short-term momentum indicator and dynamic support/resistance.
2. Kijun-sen (Base Line): medium-term momentum indicator and stronger support/resistance, also used as a trailing stop.
3. Senkou Span A (Leading Span A): forms the leading edge of the cloud (Kumo), projected 26 periods ahead.
4. Senkou Span B (Leading Span B): forms the trailing edge of the cloud, projected 26 periods ahead.
5. Chikou Span (Lagging Span): current closing price plotted 26 periods back, confirming trends and potential reversals.
The cloud (Kumo), formed between Senkou Span A and B, represents support and resistance zones, with thickness indicating volatility and strength. The indicator provides trend determination, entry and exit signals, and support/resistance levels. It is applicable across various markets including Forex, stocks, commodities, cryptocurrencies, and indices, and works best in trending markets and multiple time frames. Risk management features include dynamic stop-loss levels based on the cloud and position sizing adjustments according to cloud thickness. Traditional settings are (9, 26, 52) periods, with common adjustments for different trading weeks.


