
Описание
Теория коробки Дарваса
Теория коробки Дарваса — это торговая техника, разработанная Николасом Дарвасом в 1950-х годах. Это стратегия торговли на основе импульса, которая использует ценовое движение для определения потенциальных точек входа и выхода на рынке.
Как работает коробка Дарваса
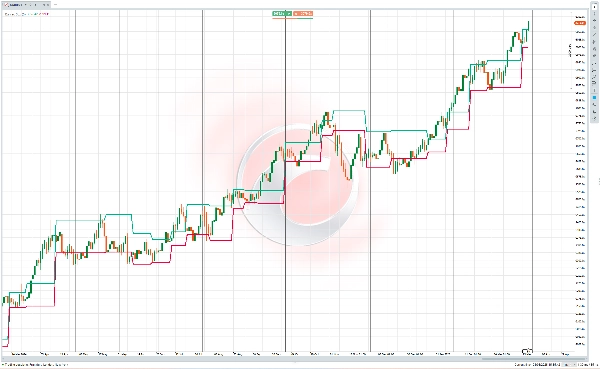
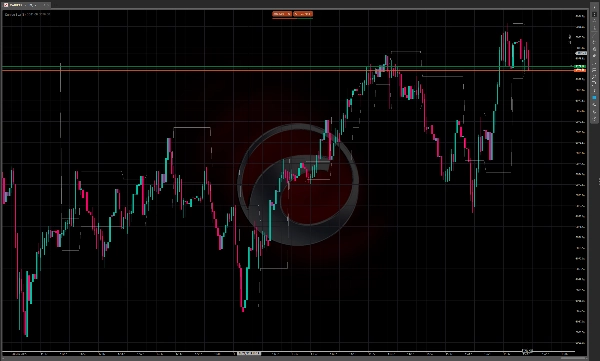
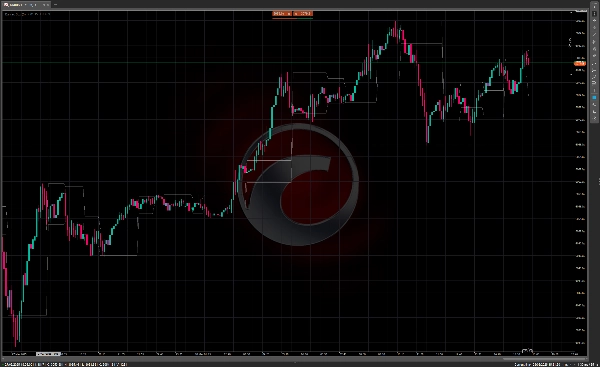
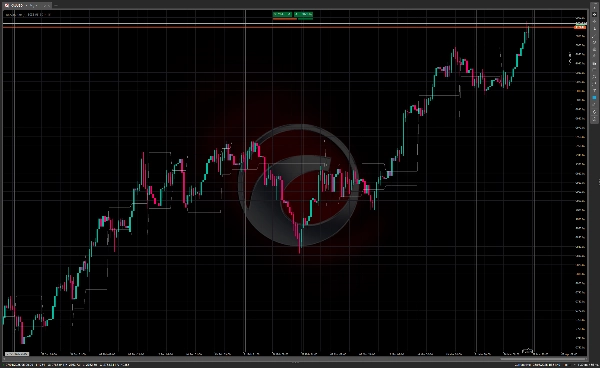
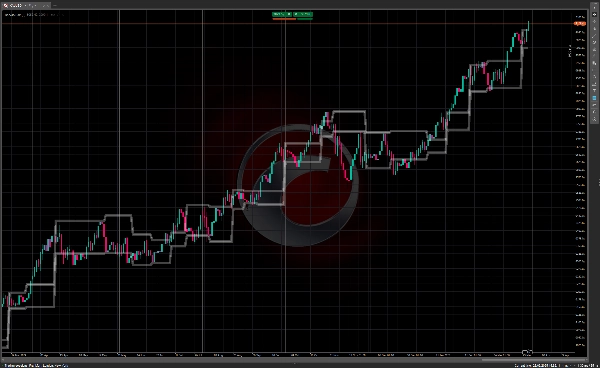
Метод коробки Дарваса включает в себя определение «коробок» или торговых диапазонов, в которых цена акции консолидируется перед прорывом. Ключевые компоненты включают:
- Цена формирует определённый торговый диапазон («коробку») с чёткими верхними и нижними границами
- Верхняя граница представляет сопротивление, а нижняя — поддержку
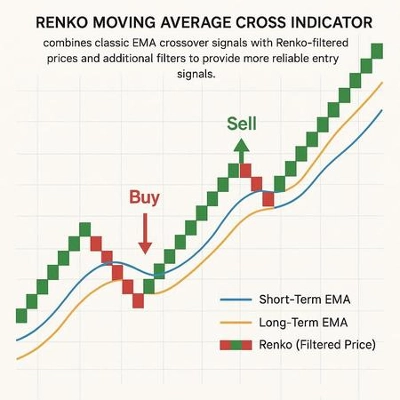
- Прорыв выше коробки сигнализирует о потенциальной возможности покупки
- Пробой ниже коробки может использоваться как сигнал к продаже
Трейдеры, использующие эту технику, обычно ищут акции с растущим объёмом вместе с движением цены, так как это указывает на более сильный импульс за прорывом.
История теории коробки Дарваса
Николас Дарвас (1920–1977) был довольно необычной фигурой в истории трейдинга. Родившись в Венгрии, он не был профессиональным трейдером по образованию, а танцором, выступавшим в бальном танцевальном дуэте «Дарвас и Джулия» со своей сводной сестрой.
Во время мирового турне со своей танцевальной труппой в 1950-х годах Дарвас начал экспериментировать с торговлей акциями. Его обстоятельства были уникальны — он часто принимал инвестиционные решения, основываясь только на биржевых таблицах в газетах, доставляемых ему в разных городах во время тура.
Дарвас разработал свою теорию коробки методом проб и ошибок. Изначально он терял деньги на рынках, но постепенно совершенствовал свой подход. Между 1956 и 1958 годами, по сообщениям, он превратил инвестицию в $10,000 в более чем $2 миллиона, используя свой метод коробки — выдающееся достижение, привлёкшее внимание.
В 1960 году Дарвас опубликовал свои методы в книге «Как я заработал $2,000,000 на фондовом рынке», которая стала классикой торговой литературы. Книга подробно описывала его путь и объясняла теорию коробки, привлекая к этому подходу широкое внимание.
Особенностью метода Дарваса была его простота и то, что он был разработан человеком, не связанным с финансовой индустрией. Он сосредоточился преимущественно на ценовом движении и объёме, а не на фундаментальном анализе — подход, который тогда был относительно новаторским, но с тех пор повлиял на многие технические торговые системы.
Техника коробки Дарваса остаётся популярной среди технических трейдеров и сегодня, особенно среди тех, кто следует стратегиям на основе импульса в трендовых рынках.


![Логотип продукта "Smart Money Concepts (SMC) [Iridio Capital]"](https://cdn.ctrader.com/image/webp/28b69fd1-ef54-4bed-9487-07e78e883be4_40934)


