
Описание
Полное руководство по анализу облака Ишимоку
История и предыстория
Ишимоку Кинко Хё (или облако Ишимоку) был разработан японским журналистом Гоичи Хосодой в конце 1930-х годов. После многих лет исследований и тестирования с командой помощников Хосода опубликовал свои результаты в 1969 году. Название "Ишимоку Кинко Хё" переводится как "график равновесия с одного взгляда", что отражает его предназначение: позволить трейдерам быстро оценивать несколько аспектов рыночного движения в одном обзоре.
Инновация Хосоды была выдающейся, так как он создал эту сложную систему задолго до появления компьютерного анализа, выполняя все расчёты вручную. Уникальность системы Ишимоку заключается в её целостном подходе, интегрирующем несколько временных интервалов и измерений рыночного анализа в единую структуру.
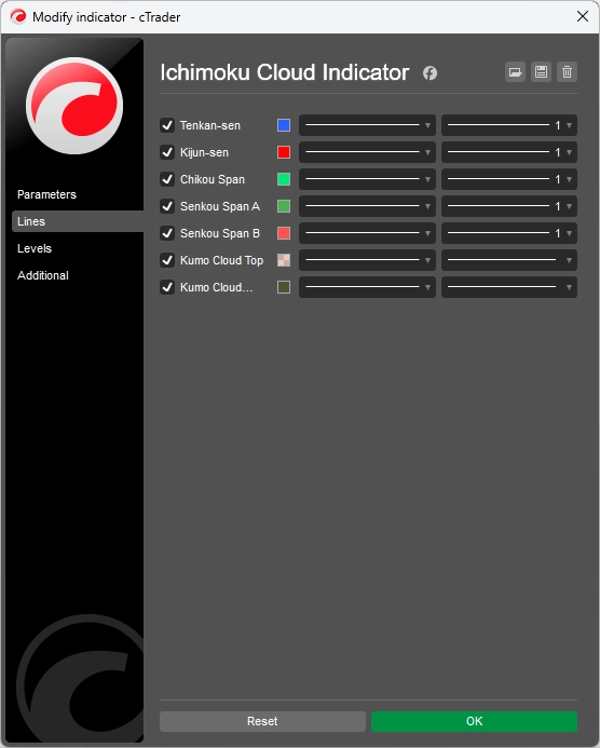
Пять компонентов облака Ишимоку
Облако Ишимоку состоит из пяти различных линий, каждая из которых предоставляет определённые сведения:
1. Тенкан-сен (линия конверсии)
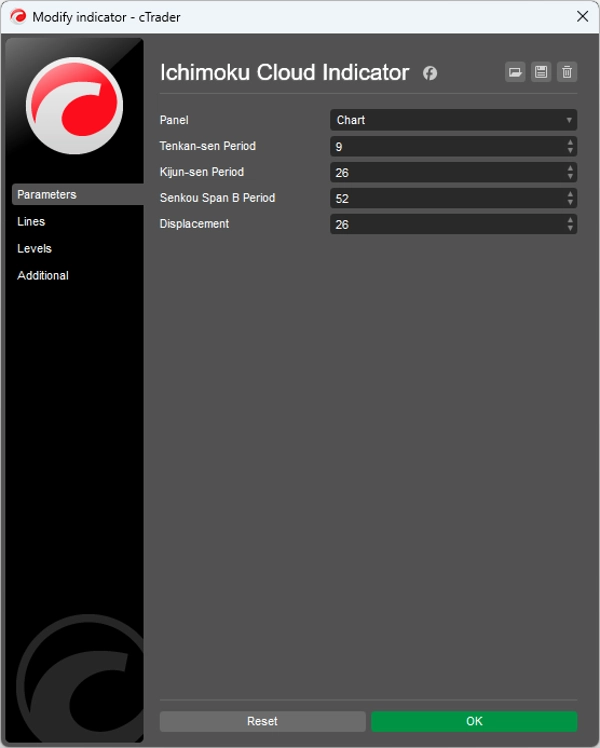
- Расчёт: (Максимум + Минимум) / 2 за последние 9 периодов
- Функция: Представляет краткосрочный рыночный импульс
- Интерпретация: Выступает как динамический уровень поддержки/сопротивления и индикатор тренда
2. Кидзун-сен (базовая линия)
- Расчёт: (Максимум + Минимум) / 2 за последние 26 периодов
- Функция: Представляет среднесрочный рыночный импульс
- Интерпретация: Выступает как более сильный уровень поддержки/сопротивления и может служить трейлинг-стопом
3. Сенкоу Спэн А (ведущая линия А)
- Расчёт: (Тенкан-сен + Кидзун-сен) / 2, отложено на 26 периодов вперёд
- Функция: Формирует передний край облака (Кумо)
- Интерпретация: Проецируемый уровень поддержки/сопротивления
4. Сенкоу Спэн B (ведущая линия B)
- Расчёт: (Максимум + Минимум) / 2 за последние 52 периода, отложено на 26 периодов вперёд
- Функция: Формирует задний край облака (Кумо)
- Интерпретация: Проецируемый уровень поддержки/сопротивления
5. Чикоу Спэн (запаздывающая линия)
- Расчёт: Текущая цена закрытия, отложена на 26 периодов назад
- Функция: Подтверждает тренды и выявляет потенциальные развороты
- Интерпретация: Когда выше цены — бычий сигнал; когда ниже — медвежий
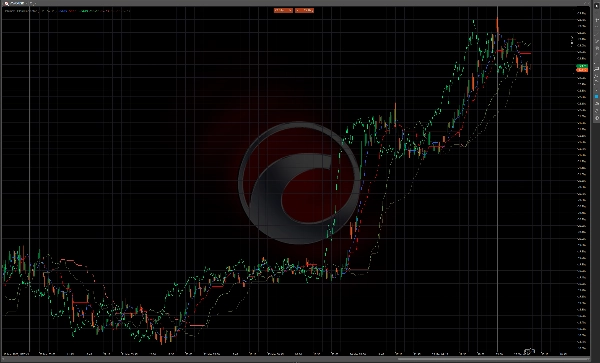
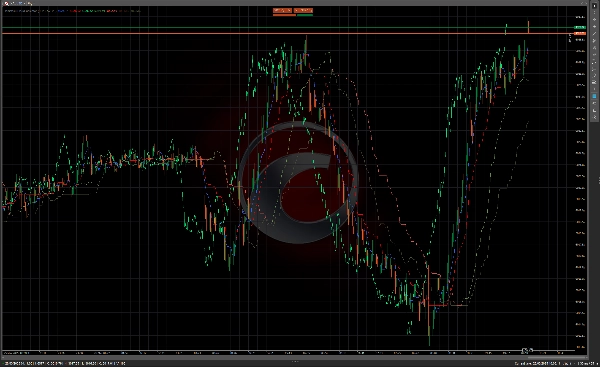
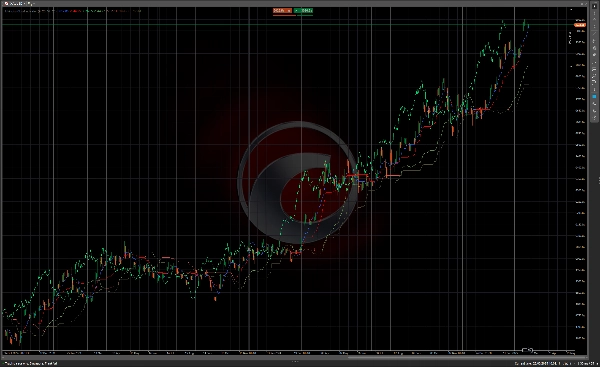
Кумо (облако)
Область между Сенкоу Спэн А и Сенкоу Спэн B называется "Кумо" или облако. Облако представляет потенциальные зоны поддержки и сопротивления, а его толщина указывает на волатильность рынка и силу этих зон.
- Толстое облако: Сильная поддержка/сопротивление, высокая волатильность
- Тонкое облако: Слабая поддержка/сопротивление, низкая волатильность
- Бычье облако: Сенкоу Спэн А выше Сенкоу Спэн B (часто окрашено в зелёный цвет)
- Медвежье облако: Сенкоу Спэн B выше Сенкоу Спэн А (часто окрашено в красный цвет)
Правила и сигналы для торговли
Определение тренда
- Критерии бычьего тренда:
-
- Цена находится выше облака
- Тенкан-сен выше Кидзун-сен
- Чикоу Спэн выше цены 26 периодов назад
- Сенкоу Спэн А растёт и выше Сенкоу Спэн B (бычье облако)
- Критерии медвежьего тренда:
-
- Цена находится ниже облака
- Тенкан-сен ниже Кидзун-сен
- Чикоу Спэн ниже цены 26 периодов назад
- Сенкоу Спэн А падает и ниже Сенкоу Спэн B (медвежье облако)
- Нейтральный/флэтовый рынок:
-
- Цена находится внутри облака
- Тенкан-сен и Кидзун-сен плоские или часто пересекаются
Сигналы для входа
Бычьи сигналы для входа
- TK Cross (пересечение Тенкан/Кидзун):
-
- Тенкан-сен пересекает Кидзун-сен сверху вниз
- Наиболее эффективно, когда цена выше облака
- Сильнее сигнал, когда облако бычье
- Прорыв Кумо:
-
- Цена пробивает облако сверху после того, как была ниже или внутри него
- Сильнее сигнал, когда облако впереди бычье (Сенкоу Спэн А > Сенкоу Спэн B)
- Подтверждение Чикоу Спэн:
-
- Чикоу Спэн пересекает цену 26 периодов назад сверху вниз
- Отсутствие сопротивления впереди для Чикоу Спэн
Медвежьи сигналы для входа
- TK Cross (медвежье):
-
- Тенкан-сен пересекает Кидзун-сен снизу вверх
- Наиболее эффективно, когда цена ниже облака
- Сильнее сигнал, когда облако медвежье
- Прорыв Кумо (медвежий):
-
- Цена пробивает облако снизу после того, как была выше или внутри него
- Сильнее сигнал, когда облако впереди медвежье (Сенкоу Спэн B > Сенкоу Спэн А)
- Подтверждение Чикоу Спэн (медвежье):
-
- Чикоу Спэн пересекает цену 26 периодов назад снизу вверх
- Отсутствие поддержки впереди для Чикоу Спэн
Сигналы для выхода
- Разворот тренда: Когда начинают появляться критерии противоположного тренда
- TK Cross: Когда Тенкан-сен пересекает Кидзун-сен в противоположном направлении
- Касание облака: Когда цена касается противоположной стороны облака
- Предупреждение Чикоу Спэн: Когда Чикоу Спэн приближается к историческим уровням цены
Уровни поддержки и сопротивления
- Немедленная поддержка/сопротивление: Тенкан-сен и Кидзун-сен
- Среднесрочная поддержка/сопротивление: Облако (сильнее на плоских участках)
- Перекрут Кумо: Когда Сенкоу Спэн А и B пересекаются, создавая потенциальные точки разворота
Продвинутые техники Ишимоку
1. Перекрут Кумо (перекрут облака)
Перекрут Кумо происходит, когда Сенкоу Спэн А и B пересекаются, создавая потенциальную точку разворота через 26 периодов в будущем. Трейдеры часто используют это как ранний сигнал предупреждения о возможных изменениях тренда.
2. Анализ временных интервалов
Многие трейдеры Ишимоку анализируют несколько временных интервалов:
- Более высокий таймфрейм для общего направления тренда
- Средний таймфрейм для сигналов входа
- Низкий таймфрейм для точного времени входа
3. Расширение/сужение Сенкоу Спэн
- Расширяющееся облако: Рост волатильности рынка, усиление тренда
- Сужающееся облако: Снижение волатильности, возможное ослабление тренда
4. Плоское Кумо (плоское облако)
Когда обе линии Сенкоу Спэн идут параллельно, это часто указывает на сильный тренд с чёткими уровнями поддержки/сопротивления.
Практические применения
Идеальные рыночные условия
Облако Ишимоку лучше всего работает на трендовых рынках и на всех временных интервалах. Его можно применять к:
- Форекс
- Акции
- Товары
- Криптовалюты
- Индексы
Управление рисками
- Используйте облако как динамический уровень стоп-лосса
- Регулируйте размер позиции в зависимости от толщины облака (толще облако = выше волатильность)
- Рассматривайте Кидзун-сен как трейлинг-стоп в сильных трендах
Совместимость с таймфреймами
Традиционные настройки (9, 26, 52) основаны на японской торговой неделе (6 дней), поэтому некоторые трейдеры корректируют эти настройки:
- 10, 30, 60 для дневных графиков
- 20, 60, 120 для более консервативных сигналов
- 7, 22, 44 для западных рынков (5-дневная торговая неделя)
Заключение
Облако Ишимоку предлагает комплексную торговую систему, которая предоставляет несколько уровней рыночной информации в одном обзоре. Его сила заключается не только в отдельных сигналах, но и в сочетании множества индикаторов, работающих вместе. Когда все компоненты совпадают, система Ишимоку может предоставить высоковероятные торговые возможности с чётко определёнными параметрами риска.
Хотя система изначально кажется сложной, с практикой трейдеры действительно могут оценивать рыночные условия "с одного взгляда", как и предполагал Хосода. Компоненты системы с временным сдвигом также дают уникальную перспективу на динамику рынка, позволяя трейдерам видеть потенциальные будущие уровни поддержки и сопротивления до того, как они станут актуальными.
Сводка
1. Tenkan-sen (Conversion Line): short-term momentum indicator and dynamic support/resistance.
2. Kijun-sen (Base Line): medium-term momentum indicator and stronger support/resistance, also used as a trailing stop.
3. Senkou Span A (Leading Span A): forms the leading edge of the cloud (Kumo), projected 26 periods ahead.
4. Senkou Span B (Leading Span B): forms the trailing edge of the cloud, projected 26 periods ahead.
5. Chikou Span (Lagging Span): current closing price plotted 26 periods back, confirming trends and potential reversals.
The cloud (Kumo), formed between Senkou Span A and B, represents support and resistance zones, with thickness indicating volatility and strength. The indicator provides trend determination, entry and exit signals, and support/resistance levels. It is applicable across various markets including Forex, stocks, commodities, cryptocurrencies, and indices, and works best in trending markets and multiple time frames. Risk management features include dynamic stop-loss levels based on the cloud and position sizing adjustments according to cloud thickness. Traditional settings are (9, 26, 52) periods, with common adjustments for different trading weeks.


![Логотип продукта "[Stellar Strategies] Smart ADX"](https://cdn.ctrader.com/image/webp/af13b084-b6f6-41db-b7bc-c7e688b57b05_36929)


