
Chaikin Money Flow
Wskaźnik
131 pobrania
Wersja 1.0, Dec 2024
Windows, Mac
5.0
Opinie: 1
Opis
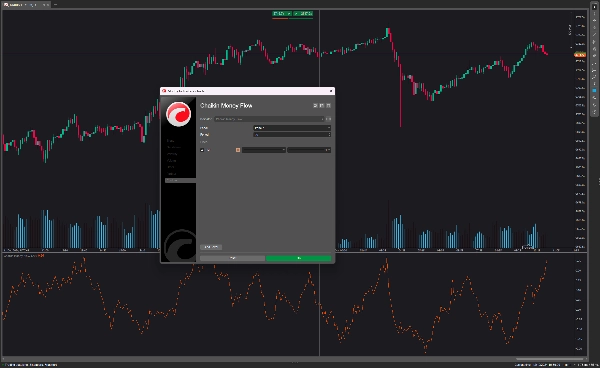
Głównym celem wskaźnika Chaikin money flow jest rozróżnienie okresów akumulacji i dystrybucji papieru wartościowego. Gdy wskaźnik znajduje się powyżej linii zerowej, wskazuje to na netto akumulację papieru wartościowego, sugerując, że inwestorzy kupują ten aktyw.
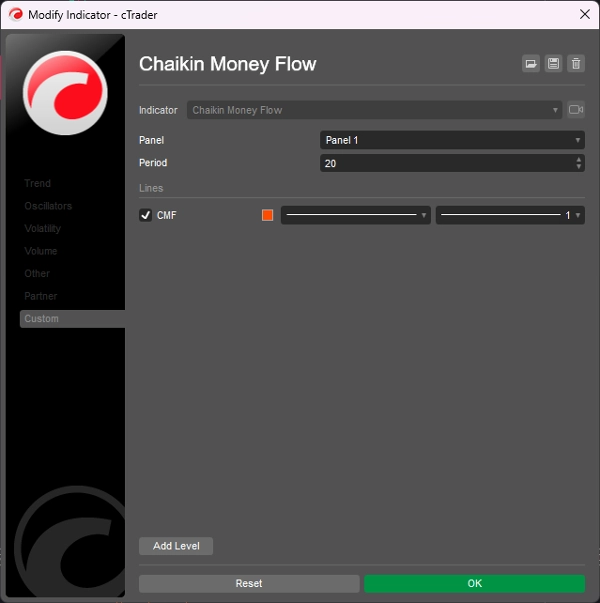
- Ustawienia Chaikin Money Flow z wartościami powyżej 30 czynią wskaźnik mniej czułym. Skutkuje to mniejszą liczbą, ale lepszej jakości sygnałów.
- Ustawienia Chaikin Money Flow z wartościami poniżej 20 czynią wskaźnik nadmiernie czułym. Skutkuje to większym szumem rynkowym.
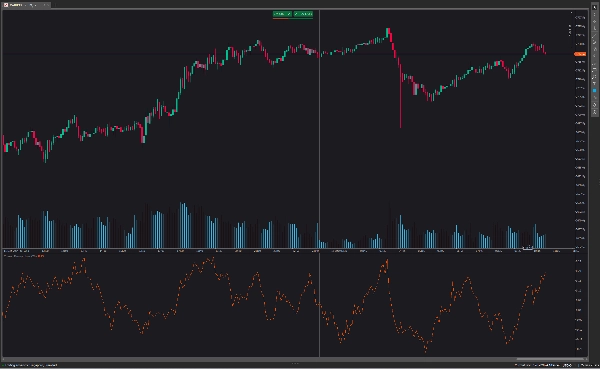
- Wskazuje na kontynuację trendu wzrostowego, gdy wskaźnik CMF przecina linię zerową z góry i generuje sygnały długie/kupna.
- Wskazuje na kontynuację trendu spadkowego, gdy wskaźnik CMF przecina linię zerową z dołu i generuje sygnały krótkie/sprzedaży.
Podsumowanie
Podsumowanie AI
The Chaikin Money Flow (CMF) indicator is designed to identify periods of accumulation and distribution for a security. When the CMF value is above zero, it signals net accumulation, indicating buying pressure. Conversely, values below zero suggest distribution or selling pressure. The indicator’s sensitivity can be adjusted: settings above 30 reduce sensitivity, producing fewer but higher-quality signals, while settings below 20 increase sensitivity, resulting in more market noise. Key signals include a continued uptrend when the CMF crosses the zero line from above, generating buy signals, and a continued downtrend when it crosses from below, generating sell signals. This tool helps traders assess buying and selling momentum to inform trading decisions.
Profil wskaźnika
Opinie klientów
5.0
Opinie: 1
5 | 100 % | |
4 | 0 % | |
3 | 0 % | |
2 | 0 % | |
1 | 0 % |
Opinie klientów
August 18, 2025
Reliable volume-based trend confirmation, easy to read, customizable period. Cons: No alerts, no MTF analysis, limited filtering options.
Dyskusja
Częste pytania
Produkty dostępne za pośrednictwem cTrader Store, w tym boty handlowe, wskaźniki i wtyczki, dostarczane są przez deweloperów zewnętrznych i udostępniane wyłącznie w celach informacyjnych oraz w celu zapewnienia dostępu technicznego. cTrader Store nie jest brokerem i nie zapewnia doradztwa inwestycyjnego, nie udziela spersonalizowanych rekomendacji ani nie gwarantuje przyszłych wyników.
Więcej od tego autora


![Logo „[Stellar Strategies] MARSI Signal Plotter”](https://cdn.ctrader.com/image/webp/7b2b8da6-8f8e-4646-8d4a-4710c516c01e_25567)


Cena
2
Sprzedaż
6.96K
Bezpłatne instalacje