
On Balance Volume
Wskaźnik
253 pobrania
Wersja 1.0, Dec 2024
Windows, Mac
5.0
Opinie: 1
Opis
On Balance Volume (OBV) mierzy presję kupna i sprzedaży jako wskaźnik skumulowany, który dodaje wolumen w dniach wzrostu i odejmuje wolumen w dniach spadku.
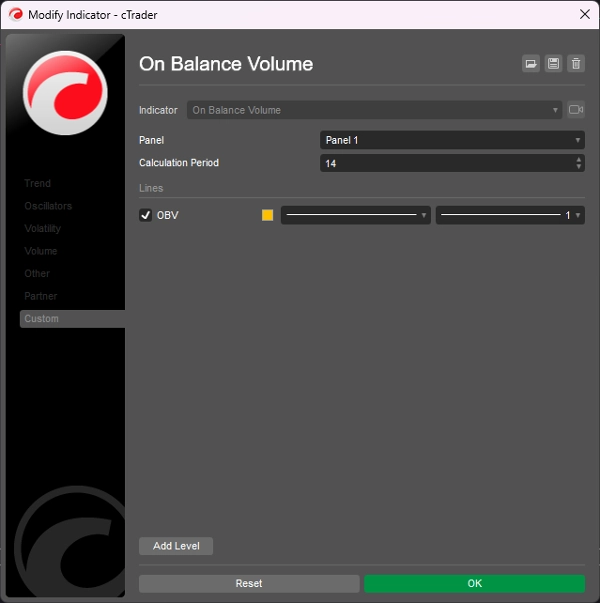
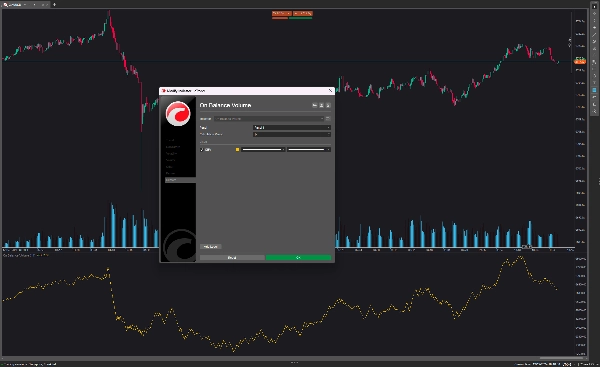
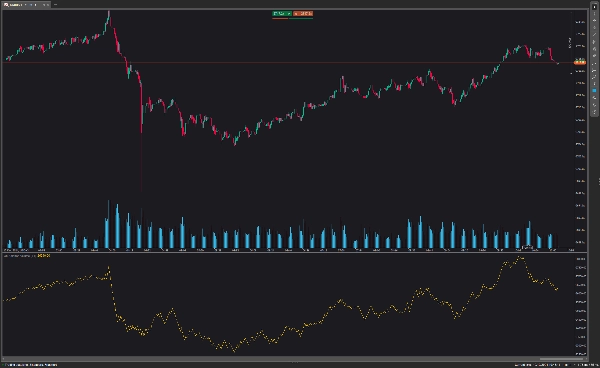
On Balance Volume jest wyświetlany na dole wykresu. Linia OBV rośnie, gdy dzienna cena zamknięcia wzrasta, a spada, gdy wczorajsza cena zamknięcia jest wyższa niż obecna.
Wskaźnik OBV zazwyczaj identyfikuje wybicie wcześniej niż linia cenowa i pomaga ustalić wyraźny trend wzrostowy. Jeśli chcesz handlować tą strategią, otwierasz pozycję forex na poziomie ceny wybicia i ustawiasz stop loss powyżej ostatniego wysokiego wahnięcia.
Podsumowanie
Podsumowanie AI
On Balance Volume (OBV) is a technical indicator that measures buying and selling pressure by cumulatively adding volume on days when the closing price rises and subtracting volume on days when it falls. Displayed at the bottom of the chart, the OBV line moves upward when today's closing price exceeds the previous day's and moves downward when it is lower. This indicator is used to identify potential breakouts ahead of price movements and to confirm upward trends. Traders using OBV may open positions at breakout price levels and set stop losses above recent high swings. The indicator is applicable in forex markets and supports breakout trading strategies.
Profil wskaźnika
Opinie klientów
5.0
Opinie: 1
5 | 100 % | |
4 | 0 % | |
3 | 0 % | |
2 | 0 % | |
1 | 0 % |
Opinie klientów
August 18, 2025
Pros: A lightweight cumulative volume indicator that confirms price moves and detects divergences. Excellent for analyzing trend strength and sentiment. Cons: No alerts, tooltips, or template features. Signals may lag in volatile or manipulated markets.
Dyskusja
Częste pytania
Forex
Breakout
Produkty dostępne za pośrednictwem cTrader Store, w tym boty handlowe, wskaźniki i wtyczki, dostarczane są przez deweloperów zewnętrznych i udostępniane wyłącznie w celach informacyjnych oraz w celu zapewnienia dostępu technicznego. cTrader Store nie jest brokerem i nie zapewnia doradztwa inwestycyjnego, nie udziela spersonalizowanych rekomendacji ani nie gwarantuje przyszłych wyników.
Więcej od tego autora


Cena
2
Sprzedaż
6.95K
Bezpłatne instalacje