Opis
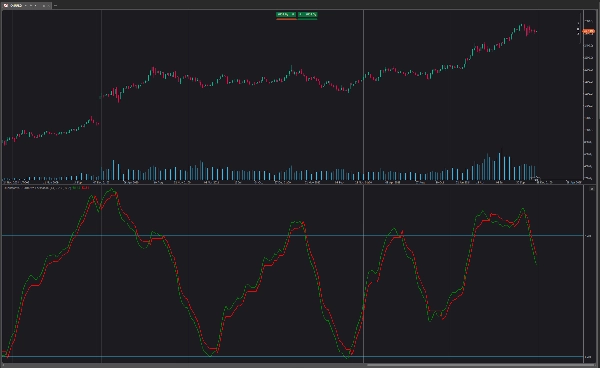
QQE (Quantitative Qualitative Estimation) Weighted Oscillator poprawia swoją oryginalną wersję, ważając RSI na podstawie wskazań podążającego stopu, co wymaga większego wysiłku, aby doszło do przecięcia z podążającym stopem. QQE Weighted Oscillator składa się z wygładzonego oscylatora RSI oraz podążającego stopu wyprowadzonego z tego samego RSI.
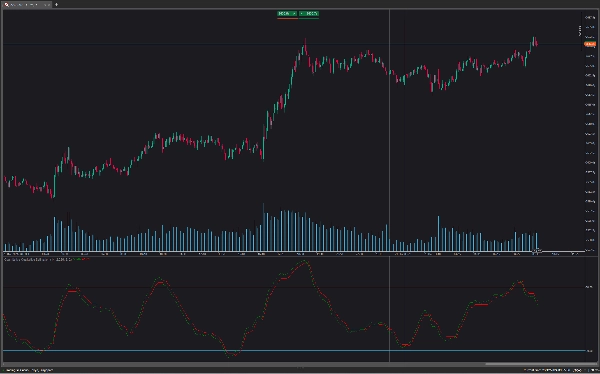
Oscylator może być używany do wskazywania, czy rynek jest wykupiony/przeciążony, a także jako wczesne wskazanie odwrócenia trendu dzięki wiodącemu charakterowi RSI.
Używanie wyższych Factor wartości zwróci dłuższy podążający stop.
Podobnie jak w przypadku zwykłego RSI, dywergencja może wskazywać na odwrócenie.
Dalsze ważenie kontroluje, ile „wysiłku” jest wymagane, aby podążający stop przeciął RSI. Na przykład, RSI powyżej podążającego stopu będzie wymagać większego stopnia negatywnych zmian cen, aby potencjalne przecięcie mogło nastąpić przy użyciu wyższych wag.
To może powodować, że wyższe wagi zwracają bardziej cykliczne i płynniejsze wyniki.
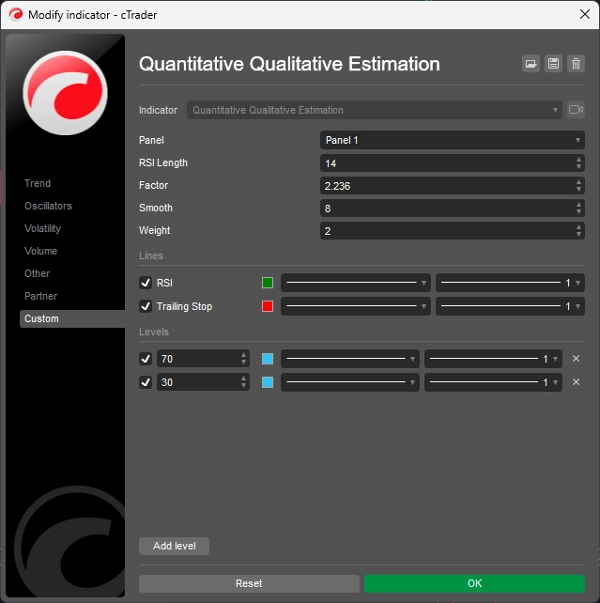
Jak zmienić ustawienia:
- Length: Długość oscylatora RSI.
- Factor: Czynnik mnożący używany do obliczania podążającego stopu.
- Smooth: Stopień wygładzenia oscylatora RSI.
- Weight: Stopień ważenia używany do obliczeń RSI.
Podsumowanie
Opinie klientów
5 | 100 % | |
4 | 0 % | |
3 | 0 % | |
2 | 0 % | |
1 | 0 % |