
KDJ
Indikator
263 downloads
Version 1.0, Dec 2024
Windows, Mac
5.0
Bewertungen: 1
Beschreibung
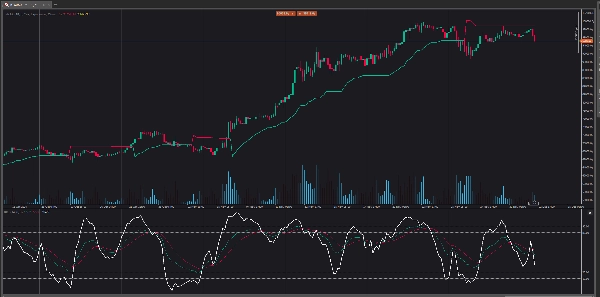
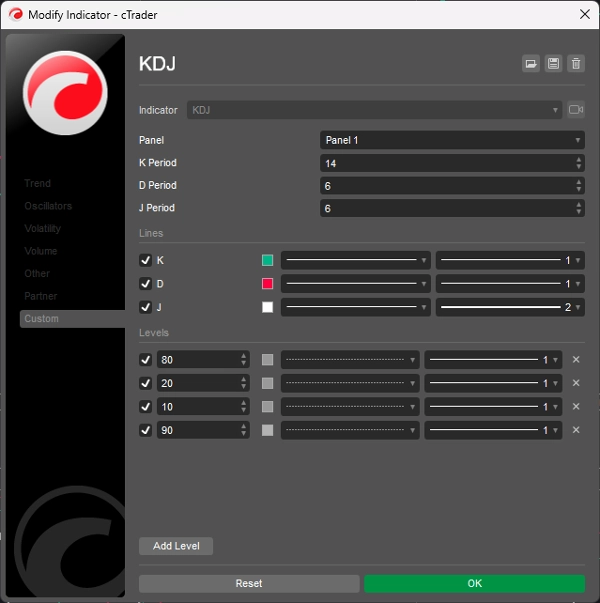
Die KDJ-Oszillatoranzeige besteht aus 3 Linien (K, D und J – daher der Name der Anzeige) und 2 Niveaus. K und D sind dieselben Linien wie beim Stochastik-Oszillator. Die J-Linie stellt die Abweichung des D-Werts vom K-Wert dar. Das Zusammenlaufen dieser Linien weist auf neue Handelsmöglichkeiten hin. Wie beim Stochastik-Oszillator entsprechen überverkaufte und überkaufte Niveaus den Zeiten, in denen sich der Trend wahrscheinlich umkehrt.
Zusammenfassung
KI-Zusammenfassung
The KDJ indicator is an oscillator consisting of three lines: K, D, and J, along with two reference levels. The K and D lines correspond to those used in the stochastic oscillator, while the J line measures the deviation of the D value from the K value. This convergence of the three lines is used to identify potential new trading opportunities. Similar to the stochastic oscillator, the KDJ indicator highlights overbought and oversold conditions, which often signal possible trend reversals. This tool is designed to assist traders in timing entries and exits by analyzing momentum and trend strength through these oscillating lines.
Indikatorprofil
Kundenbewertungen
5.0
Bewertungen: 1
5 | 100 % | |
4 | 0 % | |
3 | 0 % | |
2 | 0 % | |
1 | 0 % |
Kundenbewertungen
August 18, 2025
Pros: Three-line stochastic oscillator (K, D, J) that identifies overbought/oversold levels and momentum shifts. Supports divergence analysis and crossovers between K and D as trading signals. Lightweight and responsive. Cons: No alerts, tooltips, or settings presets. J‑line can generate outlier v
Diskussion
Häufig gestellte Fragen (FAQ)
Über den cTrader Store verfügbare Produkte, einschließlich Handelsbots, Indikatoren und Plugins, werden von externen Entwicklern bereitgestellt und nur zu Informations- und technischen Zugriffszwecken verfügbar gemacht. cTrader Store ist kein Broker und erbringt keine Anlageberatung, persönlichen Empfehlungen oder eine Garantie für zukünftige Performance.
Mehr von diesem Autor


Preis
2
Verkäufe
6.95K
Kostenlose Installationen