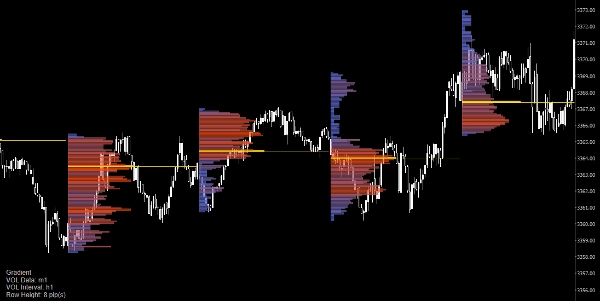
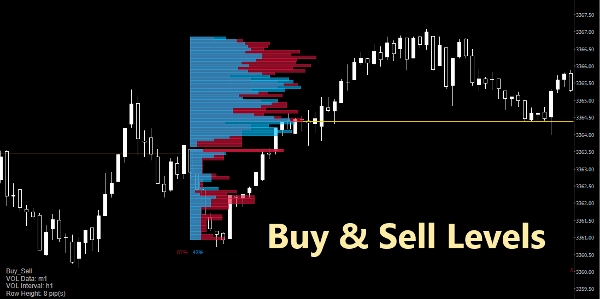
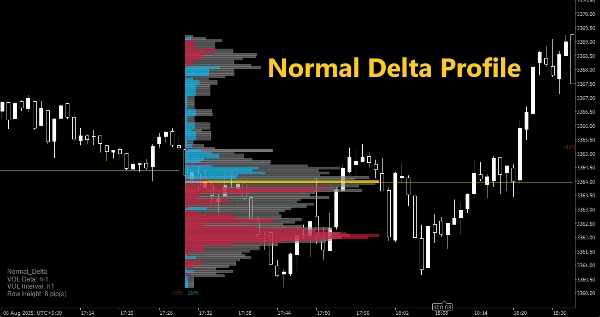
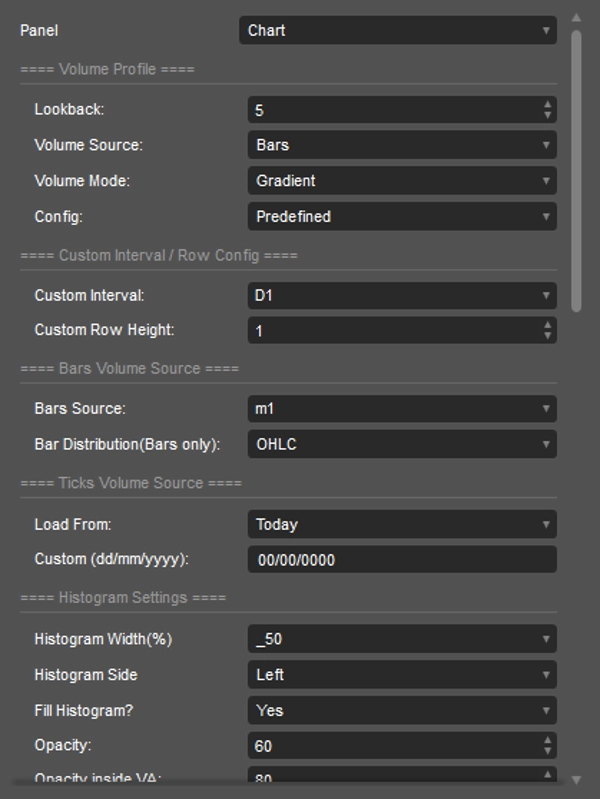
Logo „Multi Volume Profile”
Multi Volume Profile
0.0
08/08/2025
0
Desktop

Unlock deeper market insight with this fully customizable Volume Profile indicator. Visualize volume distribution in any timeframe with adjustable row heights, price and time intervals, and color gradients. Highlight key buy & sell levels, track auction high/low, and overlay real-time delta profiles to gauge aggressive buying vs. selling pressure.

Whether you’re swing trading or scalping, switch between multiple profile types—Standard, Bid/Ask, Delta—and tune appearance to your chart’s theme. Multi-timeframe support lets you compare session, daily, and custom-range profiles side by side. Perfect for spotting value areas, volume point of control, and imbalances at a glance.

More from this author
Wskaźnik
breakout
ai
signal
Verve Ai Range Scalper
ICT Channel – Precision buy/sell signals , customizable settings , User-Friendly Interface
RSI NanoScalper
Custom trading bot: select lot size, set pip-based TP/SL, and automate trade entries with built-in safety controls.
Gold Candle 100 Range
Dynamic, color‑coded candles reveal market shifts instantly—spot momentum and trend reversals at a glance
Quantum Martingale
AI-powered martingale trading bot with smart risk control and dynamic position scaling.
Zero Lag MACD
Zero Lag MACD delivers ultra-responsive trend and divergence signals with minimal lag, empowering timely Forex entries.
Trade Assistant Fx
Advanced forex trade panel for risk, margin, swaps, and trade control with precision tools.
Możesz także polubić
Renko Reversal
Renko Reversal catches powerful wick rejections on cTrader.
Time To Break Even Lite Version
This is the trial version of Time To Break Even, which help you time your trade entry.
Price Speed or Acceleration v1
This Indicator will display either the speed or the acceleration of the current symbol.
Wskaźnik
breakout
supertrend
rsi
All Support and Resistance Levels
"Identify key market zones and visualize support/resistance from multiple timeframes on a single chart.
High TF Plotter
Captra High TF Plotter visualizes high timeframe Bar on lower timeframe charts, highlighting with bull/bear colors.
RT MACD Histogram
Enhance MACD Histogram! Visualize bull and bear price changes with vibrant colors for clearer, more insightful trading.
IR VLine
don't move to the end of chart after timeframe changing. it should be better to use for near history. for long history
pATR
An indicator that redefines ATR by applying a percentile-based filter giving traders a grounded view of volatility.
KANDIKA HEAT MAP
Color-Based Market Pressure & Volatility Visualizer The Kandika Heatmap Indicator
LT_FairValueGap
Detects valid Fair Value Gaps from strong 3-bar patterns. Keep drawing unfilled gaps until price fills them.
Candlestick Patterns - Special Candles
Boost your trading with Candlestick Patterns for cTrader – auto-detect key signals for smarter, faster decisions!
Candle Timer & Strength
Candle Timer & Strength for cTrader Description: Candle Timer & Strength is a powerful and intuitive indicator for cTrad
Wskaźnik
bollinger
indices
rsi
+3
Divergency 1.1_withSourceCode
🔍 Divergency Indicator for cTrader (Update v1.1)
FVG
The Indicator is a powerful tool for price-action traders seeking to identify and exploit short-term imbalances.
IVB 2.0
IVB 2.0 is an indicator that works on the strategy of imbalance of the maximum volatility box of indices
SmartFibonacci
SmartFibonacci — automatic Fibonacci retracements & extensions with swing detection, alerts and clean labels for cTrader
Parabolic RSI Alert  V1
Master RSI reversals with Parabolic SAR precision! Get real-time alerts for high-probability trend changes.
Wskaźnik
rsi
signal
Wyckoff Toolkit [Iridio Capital]
The Wyckoff Toolkit is the ultimate ally for traders seeking to decode the market through the lens of "smart money."