
Zero Lag LSMA
Wskaźnik
6 zakupy
Wersja 1.0, Aug 2025
Windows, Mac
4.6
Opinie: 3
Opis
The Zero Lag LSMA (Least Squares Moving Average) to nowoczesny wskaźnik techniczny zaprojektowany dla traderów poszukujących zwiększonej reaktywności i precyzji w analizie trendów. W przeciwieństwie do tradycyjnych średnich kroczących, które opóźniają się za ruchem cen, minimalizuje opóźnienie poprzez zastosowanie podwójnego procesu regresji liniowej, co czyni go idealnym do identyfikacji kierunku trendu i potencjalnych odwróceń w czasie rzeczywistym. Ten wskaźnik jest doskonały dla rynku forex, akcji, surowców i innych rynków.
Kluczowe cechy
- Zero-Lag Performance: Redukuje opóźnienie charakterystyczne dla tradycyjnych średnich kroczących, dostarczając szybsze sygnały zmian trendu.
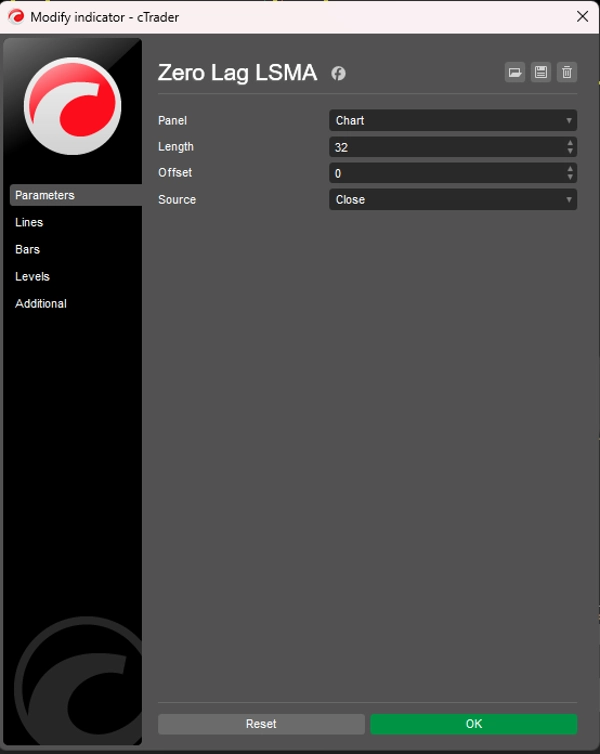
- Customizable Parameters: Dostosuj długość, przesunięcie i źródło ceny (Open, High, Low, Close) do swojej strategii handlowej.
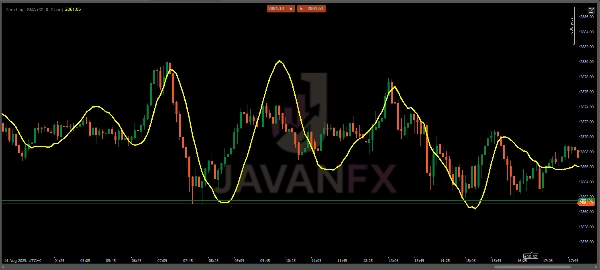
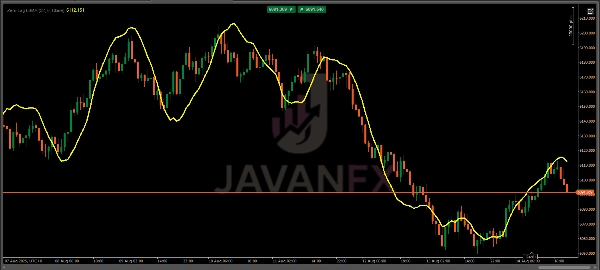
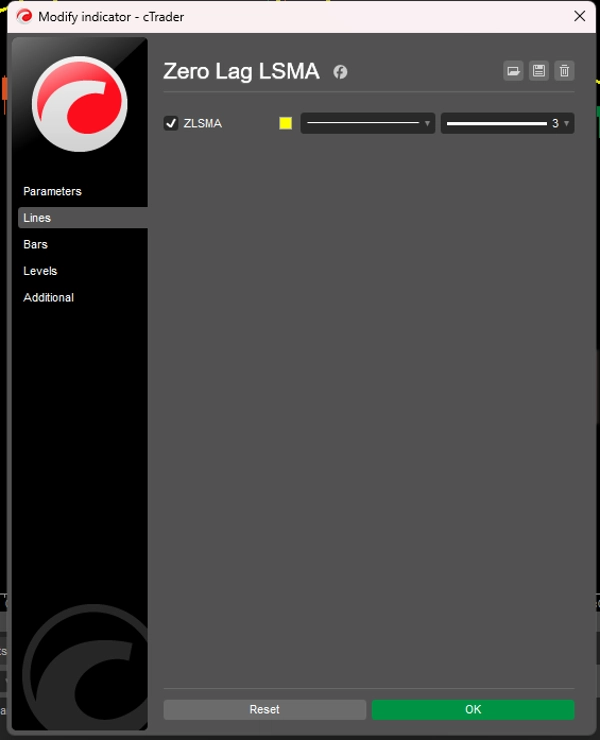
- Visually Intuitive: Wyświetla się jako gładka, żółta linia nałożona na wykres cenowy dla łatwej interpretacji.
- Versatile Application: Nadaje się do skalpowania, day tradingu, swing tradingu oraz strategii długoterminowych na różnych interwałach czasowych.
Jak używać
- Identyfikacja trendu:
-
- Gdy linia ZLSMA nachyla się w górę, wskazuje to na trend wzrostowy.
- Nachylenie w dół sugeruje trend spadkowy.
- Płaski lub nieregularny ruch może wskazywać na konsolidację lub brak trendu.
- Sygnały wejścia/wyjścia:
-
- Sygnał kupna: Wejdź w pozycję długą, gdy cena przebije linię ZLSMA od dołu, szczególnie po potwierdzonym trendzie wzrostowym.
- Sygnał sprzedaży: Wejdź w pozycję krótką, gdy cena przebije linię ZLSMA od góry podczas trendu spadkowego.
- Sygnał wyjścia: Rozważ wyjście, gdy cena ponownie przebije linię ZLSMA lub gdy linia się wypłaszcza, co wskazuje na potencjalne odwrócenie trendu.
- Potwierdzenie:
-
- Łącz ZLSMA z innymi wskaźnikami (np. RSI, MACD) lub poziomami wsparcia/oporu, aby potwierdzić sygnały i uniknąć fałszywych wybicia.
- Używaj na wyższych interwałach czasowych (H1, H4, D1) dla silniejszych sygnałów trendu lub na niższych (M5, M15) do skalpowania.
Strategie handlowe
- Podążanie za trendem: Używaj ZLSMA, aby podążać za silnymi trendami, wchodząc na cofnięcia do linii ZLSMA w kierunku trendu.
- Trading odwróceń: Szukaj dywergencji ceny względem linii ZLSMA w połączeniu z formacjami świecowymi (np. pin bary, formacje pochłaniające) dla ustawień odwrócenia.
- Trading wybicia: Monitoruj wybicia cen powyżej/poniżej ZLSMA podczas okresów wysokiej zmienności w celu znalezienia potencjalnych punktów wejścia.
Wskazówki do optymalnego użycia
- Dostosuj długość do warunków rynkowych: Używaj krótszej długości (np. 10-20) dla szybszych rynków lub skalpowania, a dłuższej (np. 50-100) dla płynniejszych trendów na wyższych interwałach.
- Testuj na koncie demo: Przed użyciem na żywo, przetestuj ZLSMA na koncie demo, aby zrozumieć jego zachowanie na preferowanych rynkach.
- Unikaj nadmiernego handlu na niestabilnych rynkach: ZLSMA działa najlepiej na rynkach trendowych; używaj dodatkowych filtrów (np. ADX), aby unikać fałszywych sygnałów na rynkach bocznych.
Podsumowanie
Podsumowanie AI
The Zero Lag LSMA (Least Squares Moving Average) is a technical indicator designed to enhance trend analysis by minimizing the lag typical of traditional moving averages. It uses a double linear regression process to provide faster and more responsive signals, making it suitable for real-time identification of trend direction and potential reversals. The indicator is applicable across various markets including forex, stocks, and commodities.
Key features include customizable parameters such as length, offset, and price source (Open, High, Low, Close), allowing adaptation to different trading strategies. It displays as a smooth yellow line overlaid on the price chart for clear visual interpretation. The indicator supports multiple trading styles and timeframes, from scalping to long-term strategies.
Traders use the Zero Lag LSMA to identify trends by observing the slope of the line: upward for bullish trends, downward for bearish, and flat for consolidation. Entry and exit signals are generated when price crosses the LSMA line, with additional confirmation recommended through other indicators or support/resistance levels. The indicator supports trend following, reversal, and breakout trading strategies, with adjustable settings to optimize performance under varying market conditions.
Profil wskaźnika
Opinie klientów
4.6
Opinie: 3
5 | 67 % | |
4 | 33 % | |
3 | 0 % | |
2 | 0 % | |
1 | 0 % |
Opinie klientów
October 10, 2025
Zero lag, full clarity ⚡ LSMA tracks price action like a scalpel — sharp, fast, and smooth. Great trend filter for any timeframe!
August 27, 2025
The only reason it stays interesting is the setup needs less second guessing. A normal demo run is enough to see the weak spots.
August 16, 2025
Not bad if the rules are already clear. Spread and slippage need a line in the notes.
Dyskusja
Częste pytania
Produkty dostępne za pośrednictwem cTrader Store, w tym boty handlowe, wskaźniki i wtyczki, dostarczane są przez deweloperów zewnętrznych i udostępniane wyłącznie w celach informacyjnych oraz w celu zapewnienia dostępu technicznego. cTrader Store nie jest brokerem i nie zapewnia doradztwa inwestycyjnego, nie udziela spersonalizowanych rekomendacji ani nie gwarantuje przyszłych wyników.


Cena
Od 14/07/2025
60
Sprzedaż