
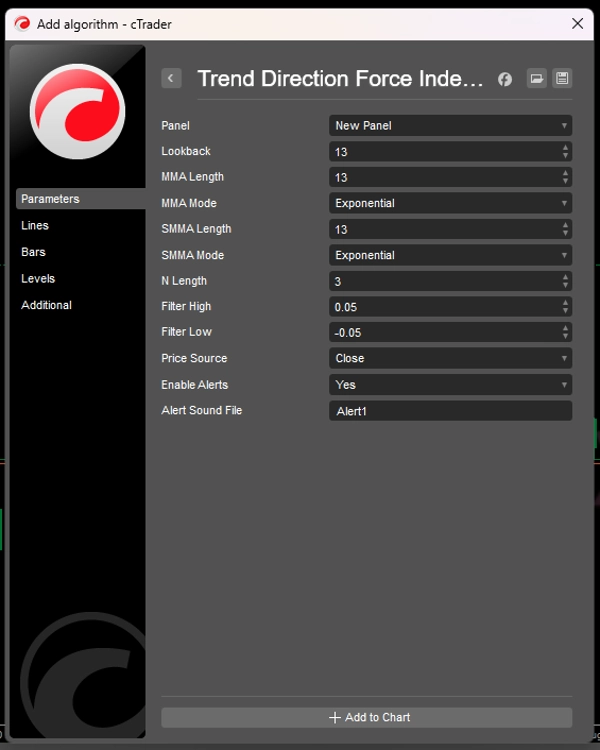
Beschreibung
Der Trend Direction Force Index (TDFI) ist ein leistungsstarker, momentum-basierter Indikator, der Tradern dabei hilft, starke Trendbewegungen und potenzielle Umkehrungen präzise zu identifizieren. Durch die Analyse der Beziehung zwischen zwei gleitenden Durchschnitten und deren Änderungsrate filtert der TDFI Marktrauschen heraus und hebt Handelsmöglichkeiten mit hoher Wahrscheinlichkeit hervor.
Hauptmerkmale:
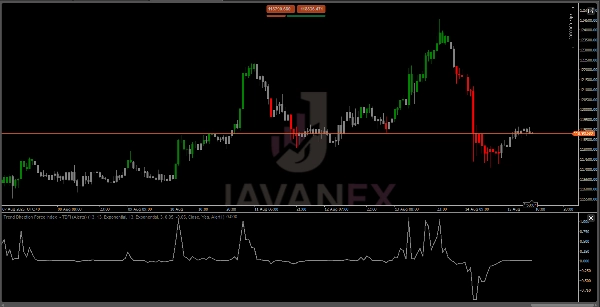
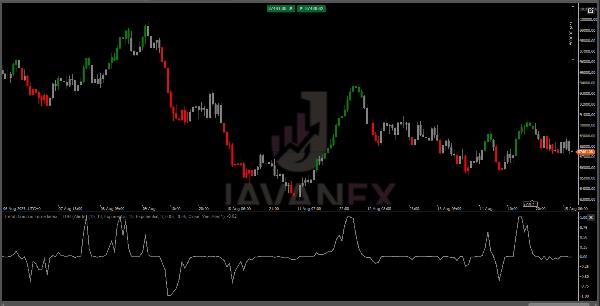
✅ Klare Trendidentifikation – Unterscheidet visuell bullisches (grün) und bärisches (rot) Momentum basierend auf anpassbaren Schwellenwerten.
✅ Adaptive Glättung – Verwendet verschiedene Arten gleitender Durchschnitte (EMA, WMA, Hull, TEMA usw.) für optimale Reaktionsfähigkeit.
✅ Rauschunterdrückung – Dynamische Normalisierung stellt sicher, dass nur signifikante Kursbewegungen Signale auslösen.
✅ Anpassbare Alarme – Erhalten Sie Echtzeit-Benachrichtigungen, wenn sich Trends verstärken oder umkehren.
✅ Funktioniert auf allen Zeitrahmen – Effektiv für Scalping, Daytrading und Swingtrading.
Wie der TDFI funktioniert
Der TDFI misst die Trendstärke durch Analyse der Divergenz und Momentum zwischen zwei speziell abgestimmten gleitenden Durchschnitten:
- MMA (Main Moving Average) – Verfolgt kurzfristiges Kursmomentum
- SMMA (Smoothed Moving Average) – Identifiziert den zugrundeliegenden Trend
Der Indikator berechnet dann:
🔹 Divergenzkraft – Wie weit die MMAs auseinanderliegen (Trendstärke)
🔹 Momentum-Beschleunigung – Wie schnell sich der Trend bewegt
🔹 Normalisierte Ausgabe – Skaliert Signale, um extreme Werte zu vermeiden
Wenn sich diese Kräfte kombinieren:
- TDFI > Oberer Schwellenwert (Grün) = Starkes bullisches Momentum
- TDFI < Unterer Schwellenwert (Rot) = Starkes bärisches Momentum
- Zwischen den Schwellenwerten (Grau) = Neutral/Konsolidierung
Zusammenfassung
Kundenbewertungen
5 | 75 % | |
4 | 25 % | |
3 | 0 % | |
2 | 0 % | |
1 | 0 % |


![„[CB] Pivot Points Pro“-Logo](https://cdn.ctrader.com/image/webp/43463c82-67b0-4f10-a4ba-901bba091d81_32594)


