
Descrizione
Screener è un indicatore dashboard rivoluzionario che trasforma
il modo in cui i trader analizzano più mercati. Invece di passare da dozzine di grafici,
ottieni tutti i tuoi segnali di mercato in un'unica dashboard unificata e in tempo reale. Monitora centinaia
di asset simultaneamente con analisi del sentiment codificata a colori, filtri intelligenti
e ordinamento istantaneo.
CARATTERISTICHE PRINCIPALI
MONITORAGGIO MULTI-ASSET
• Traccia TUTTI gli asset dalla tua watchlist in un unico posto
• Analisi del sentiment in tempo reale per Forex, Azioni, Cripto e Commodities
• Niente più salto tra grafici - vedi tutto a colpo d'occhio
RILEVAMENTO INTELLIGENTE DEI SEGNALI
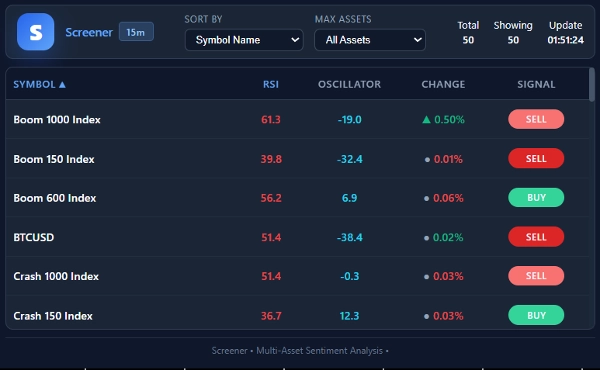
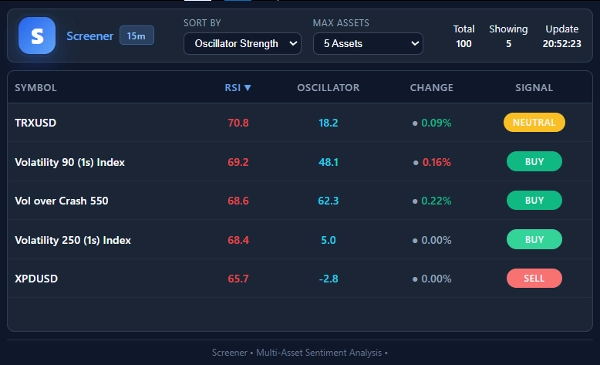
• Segnali Codificati a Colori:
🟢 ACQUISTO FORTE - Sentiment estremamente rialzista
🟢 ACQUISTO - Bias rialzista
🟡 NEUTRALE - Mercato equilibrato
🔴 VENDITA - Bias ribassista
🔴 VENDITA FORTE - Sentiment estremamente ribassista
• Metriche Complete per Asset:
- Momentum RSI (periodo 14)
- Oscillatore Alpha
- Percentuale di variazione del prezzo
- Segnale di trading chiaro
CONTROLLI INTELLIGENTI DELLA DASHBOARD
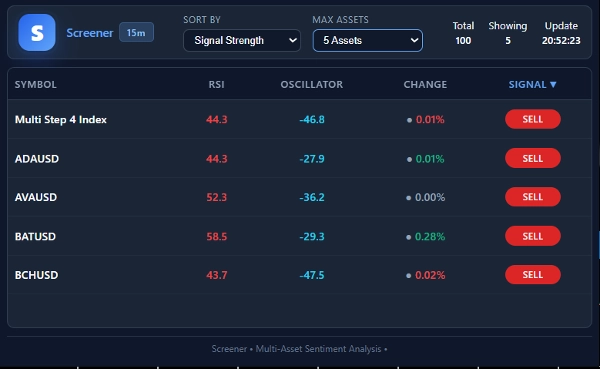
• Ordinamento Dinamico:
- Ordina per forza dell'oscillatore (segnali più forti per primi)
- Ordina per forza del segnale (segnali estremi in cima)
- Ordina per RSI, variazione del prezzo o nome del simbolo
- Clicca su qualsiasi intestazione di colonna per riordinare istantaneamente
• Filtraggio Intelligente:
- Limita la visualizzazione ai primi 5, 10, 15 o 20 asset
- Mostra tutti gli asset contemporaneamente
- Filtraggio in tempo reale basato sulle tue preferenze
AGGIORNAMENTI IN TEMPO REALE
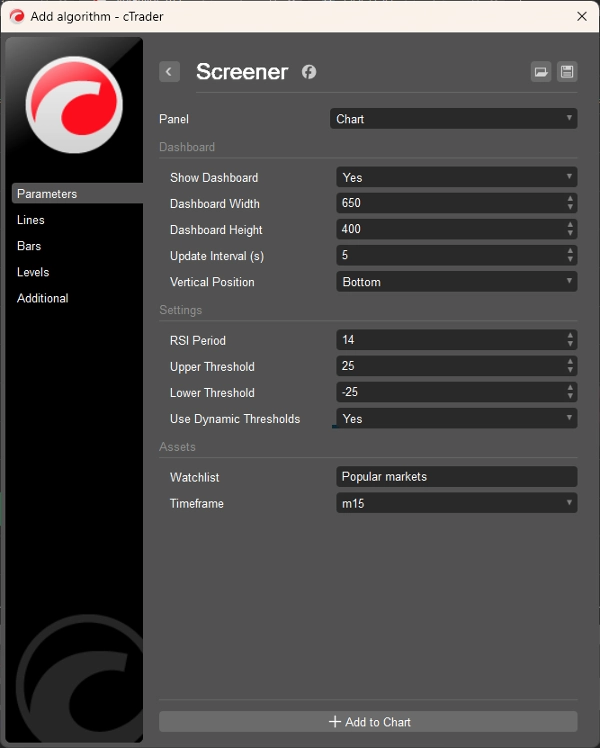
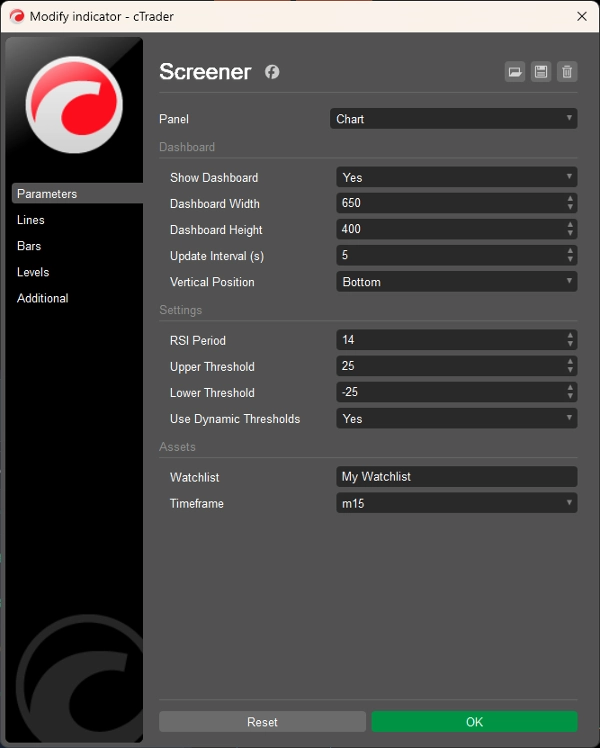
• Aggiornamenti automatici ogni 5 secondi (configurabile)
• Dati live senza aggiornamento manuale
• Visualizzazione del timestamp che mostra l'ultimo aggiornamento
DESIGN UI PROFESSIONALE
• Tema scuro ottimizzato per il trading
• Layout della tabella pulito e organizzato
• Dimensione e posizione della dashboard personalizzabili
CASI D'USO
PER I DAY TRADER:
• Scansiona più di 50 coppie in meno di 10 secondi
• Identifica le opportunità intraday più forti
• Filtra il rumore, concentrati su setup ad alta probabilità
PER I SWING TRADER:
• Monitora più timeframe simultaneamente
• Individua tendenze emergenti tra le classi di asset
• Imposta avvisi per letture estreme del sentiment
PER I GESTORI DI PORTAFOGLIO:
• Panoramica del sentiment dell'intero portafoglio
• Valutazione del rischio tra le posizioni
• Analisi della diversificazione a colpo d'occhio
PER GLI ANALISTI DI MERCATO:
• Mappa del calore del sentiment tra i mercati
• Analisi della correlazione tra asset
• Indicatori di ampiezza di mercato
STRATEGIE DI TRADING
1. SCANSIONE DEL MOMENTUM
• Ordina per forza dell'oscillatore → Tratta i segnali più forti
• Perfetto per strategie di breakout e momentum
• Cattura i movimenti precocemente con letture estreme
2. RITORNO ALLA MEDIA
• Ordina per RSI → Trova condizioni di ipercomprato/ipervenduto
• Combina con oscillatore per conferma
• Ideale per mercati laterali
3. ANALISI CROSS-ASSET
• Confronta segnali tra coppie correlate
• Individua divergenze tra asset
• Copri posizioni basate sulla correlazione
4. ESTREMI DI SENTIMENT
• Filtra solo segnali di ACQUISTO/VENDITA FORTE
• Opera contro il sentiment estremo
• Posizionati per potenziali inversioni
RISULTATI ATTESI
BENEFICI IMMEDIATI:
• Elimina la fatica del salto tra grafici
• Riduci il tempo di analisi dell'80-90%
• Migliora la coerenza dei segnali
• Aumenta la consapevolezza del mercato
VANTAGGI A LUNGO TERMINE:
• Sviluppa una migliore intuizione di mercato
• Identifica schemi tra più asset
• Prendi decisioni di trading più informate
• Ottimizza l'allocazione del portafoglio
PER CHI È?
PERFETTO PER:
• Trader attivi che monitorano più mercati
• Swing trader in cerca di conferma del setup
• Principianti che necessitano di segnali chiari e azionabili
• Esperti che vogliono semplificare l'analisi
• Analisti che studiano il sentiment di mercato
• Gestori di portafoglio che supervisionano più posizioni
LIVELLI DI COMPETENZA:
• Adatto ai principianti: configurazione semplice, segnali chiari
• Valore intermedio: capacità di analisi approfondita
• Strumento per esperti: scansione di livello professionale
INIZIA OGGI
PERCHÉ SCEGLIERE SCREENER?
1. Panoramica completa del mercato - Vedi tutto, non perdere nulla
2. Analisi di livello professionale - Scansione a livello istituzionale
3. Risparmio di tempo - Recupera ore di tempo di analisi
4. Facile da usare - Configurazione in pochi minuti, nessuna programmazione richiesta
5. Risultati comprovati - Utilizzato da migliaia di trader in tutto il mondo
================================================================
TRASFORMA IL TUO FLUSSO DI LAVORO DI TRADING. VEDI TUTTI I TUOI MERCATI IN UN UNICO POSTO.
PRENDI DECISIONI DI TRADING PIÙ VELOCI E INTELLIGENTI CON SCREENER.
================================================================
I trader professionisti non saltano tra i grafici - usano gli strumenti giusti.
Screener è quello strumento.
Riepilogo
Key metrics per asset include 14-period RSI momentum, an Alpha Oscillator, price change percentage, and a clear trading signal. The dashboard supports dynamic sorting by oscillator strength, signal strength, RSI, price change, or symbol name, and offers smart filtering to display a selected number of top assets or the full list. Updates occur automatically every 5 seconds, ensuring live data without manual refresh.
The user interface is optimized with a dark theme and customizable layout for professional use. Screener suits various trading styles and roles, including day traders, swing traders, portfolio managers, and market analysts. It supports strategies such as momentum scanning, mean reversion, cross-asset analysis, and trading based on sentiment extremes. The indicator aims to streamline market monitoring, reduce analysis time, and enhance decision-making by providing a comprehensive, real-time market overview.
Recensioni dei clienti
5 | 50 % | |
4 | 50 % | |
3 | 0 % | |
2 | 0 % | |
1 | 0 % |


![Logo di "[Stellar Strategies] MARSI Signal Plotter"](https://cdn.ctrader.com/image/webp/7b2b8da6-8f8e-4646-8d4a-4710c516c01e_25567)


