HTF candles with Timeframe Alignment
Indikator
2 käufe
Version 2.0, Apr 2026
Windows, Mac
4.5
Bewertungen: 2
Trading product for HTF candles with Timeframe Alignment Indikator Forex Indices, image 2
Trading product for HTF candles with Timeframe Alignment Indikator Forex Indices, image 3
Trading product for HTF candles with Timeframe Alignment Indikator Forex Indices, image 4
Trading product for HTF candles with Timeframe Alignment Indikator Forex Indices, image 5
Trading product for HTF candles with Timeframe Alignment Indikator Forex Indices, image 6
Trading product for HTF candles with Timeframe Alignment Indikator Forex Indices, image 7
2
Verkäufe

Beschreibung

HTF Bias Detector — Panel Edition

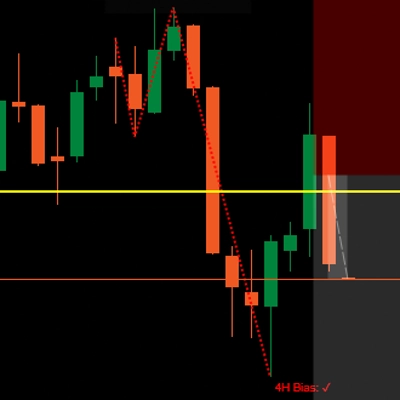
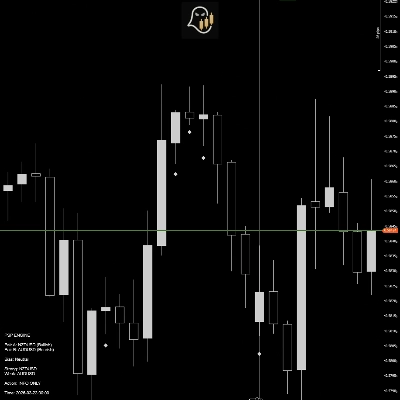
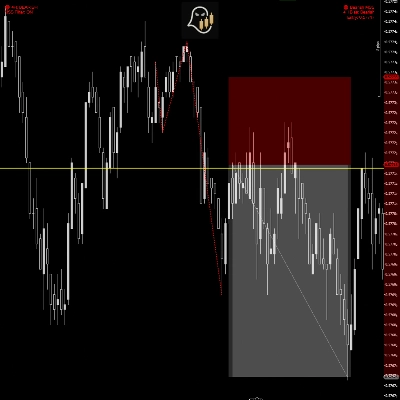
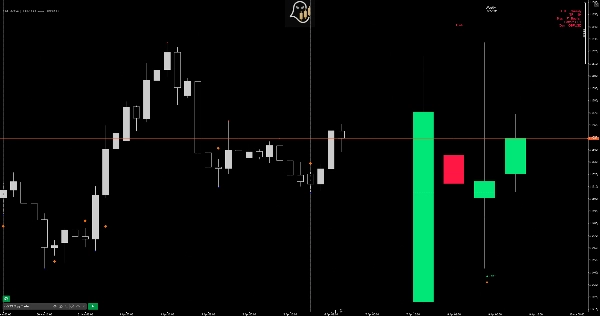
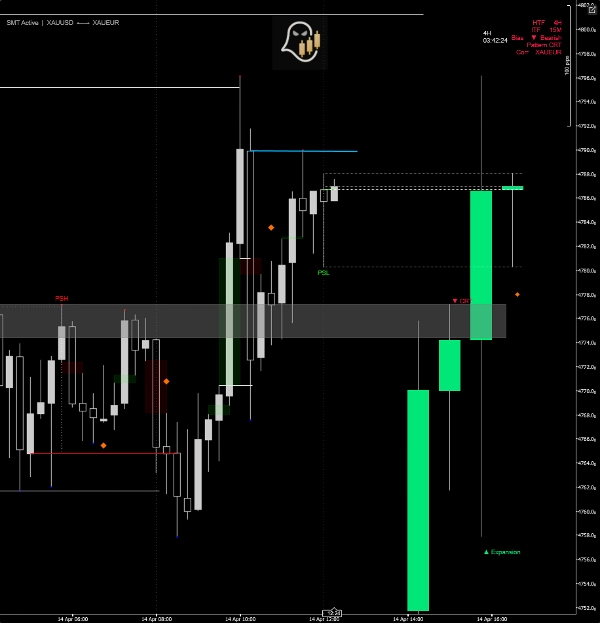
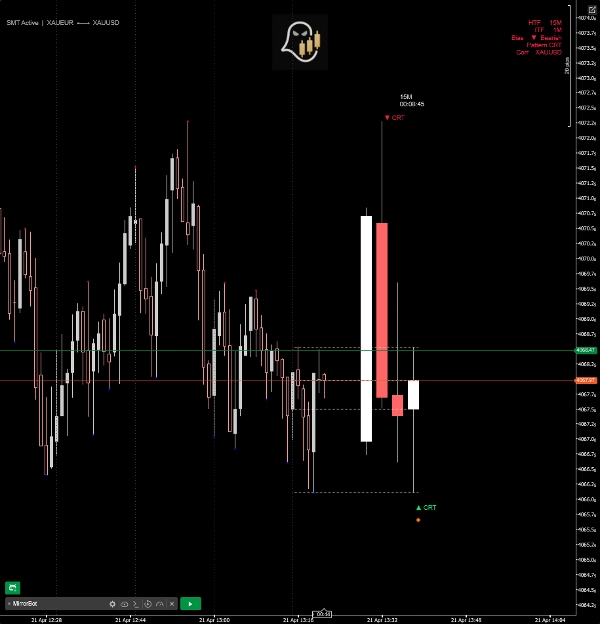
Sehen Sie die Geschichte des höheren Zeitrahmens auf einen Blick. HTF Bias Detector zeigt die letzten N Kerzen des höheren Zeitrahmens in einem schwebenden Panel direkt auf Ihrem Chart an — kein Wechsel des Zeitrahmens erforderlich — und identifiziert automatisch die dominante Tendenz anhand von vier institutionellen Preisaktionsmustern.

Wie es funktioniert

Der Indikator ordnet Ihren aktuellen Chart-Zeitrahmen seinem natürlichen höheren Zeitrahmen zu (z. B. 5M → 1H, 1H → Täglich) und zeichnet diese HTF-Kerzen in einem sauberen Panel, das rechts neben dem Preis verankert ist. Die Mustenerkennung läuft dann in Echtzeit auf diesen Kerzen.

Erkannte Muster

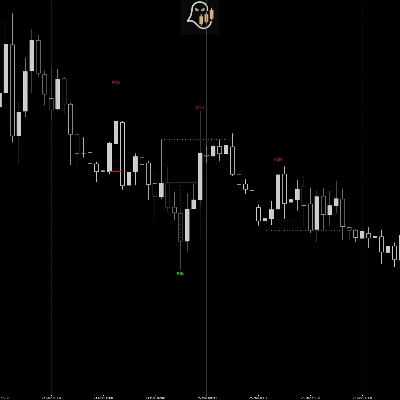
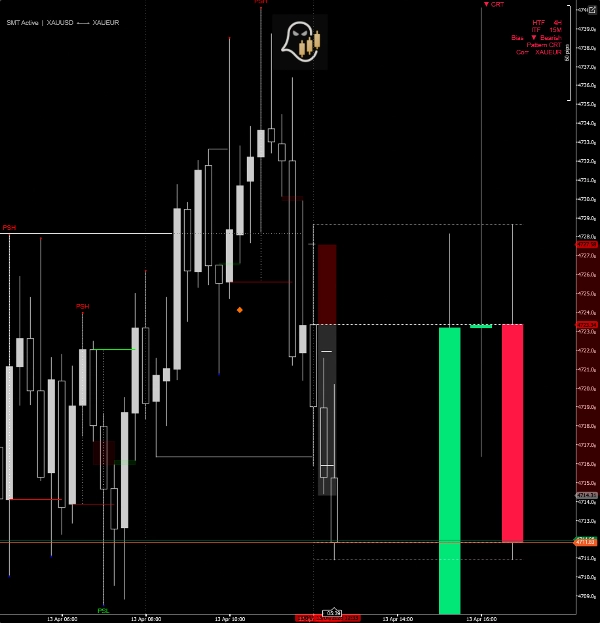
  • CRT (Candle Range Theory) — identifiziert Trap-Kerzen, die ein vorheriges Hoch oder Tief durchlaufen und wieder innerhalb schließen, was auf eine wahrscheinliche Umkehr hinweist.
  • Expansion — markiert Kerzen, die den vorherigen Bereich vollständig umschließen und darüber hinaus schließen, was die Richtungsdynamik bestätigt.
  • Swing Point — erkennt Drei-Kerzen-Sequenzen, bei denen eine Verschiebungskerze von einer starken Umkehr gefolgt wird, was einen strukturellen Wendepunkt markiert.
  • PSP (Precision Swing Point) — Signal für Divergenz zwischen Paaren. Wenn das primäre Symbol und sein korreliertes Paar entgegengesetzte Richtungs-Kerzen im selben HTF-Balken zeigen, wird ein PSP-Diamant eingezeichnet.

SMT Divergenz (HTF Panel)

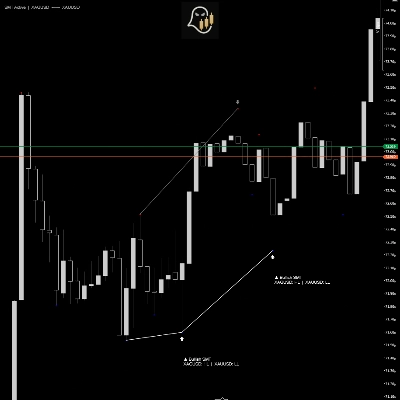
Vergleicht aufeinanderfolgende HTF-Kerzenpaare zwischen korrelierten Instrumenten. Wenn ein Paar ein tieferes Tief macht, während das andere ein höheres Tief bildet (oder umgekehrt bei Hochs), wird eine SMT-Divergenzlinie direkt im Panel mit einer Richtungsbeschriftung gezeichnet.

Automatische Erkennung korrelierter Paare

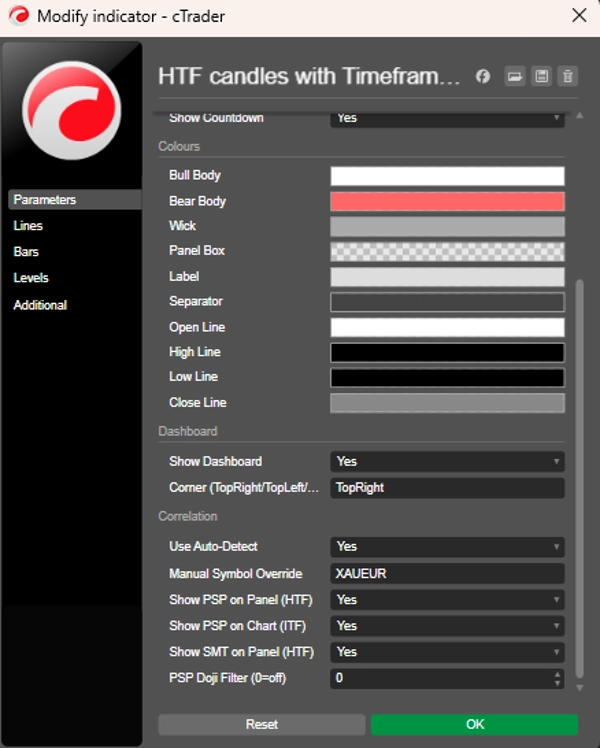
Ermittelt automatisch das korrelierte Instrument für Ihr Chart-Symbol — abdeckend die wichtigsten Forex-Paare, Metalle, Indizes und Kryptowährungen. Eine manuelle Überschreibung ist ebenfalls verfügbar für benutzerdefinierte Paarungen oder brokerspezifische Symbolnamen.

Zusätzliche Funktionen

  • Live-Countdown-Timer bis zum nächsten HTF-Kerzenabschluss
  • OHLC-Punktlinien als Referenz für die aktuell entstehende HTF-Kerze
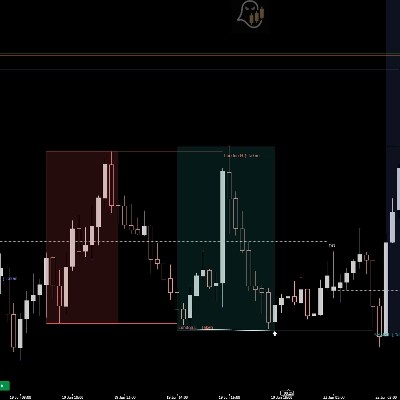
  • Vertikale Trenner im Live-Chart, ausgerichtet an HTF-Eröffnungszeiten
  • Kompaktes Dashboard mit HTF, ITF, erkannter Tendenz, Mustername und korreliertem Paar
  • ITF PSP-Diamanten direkt auf Chart-Balken eingezeichnet (aktueller Zeitrahmen)
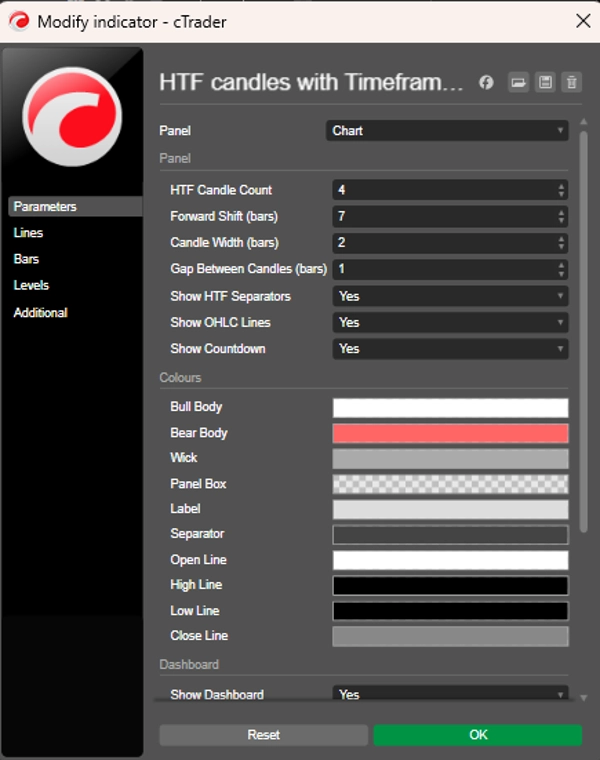
  • Vollständig anpassbare Farben, Panelbreite, Kerzenanzahl und Positionierung
  • Doji-Filter zur Unterdrückung schwacher PSP-Signale

Zeitrahmen-Mapping

Chart TF HTF Panel

1M – 4M 15M

5M – 10M 1H

15M – 30M 4H

1H Täglich

4H Wöchentlich

Täglich Monatlich


Zusammenfassung

KI-Zusammenfassung
HTF Candles with Timeframe Alignment is a market structure indicator designed to display higher timeframe (HTF) candle data directly on your current chart via a floating panel. It automatically maps the chart’s timeframe to its natural higher timeframe (e.g., 5-minute to 1-hour, 1-hour to daily) and renders the last N HTF candles for quick visual reference without switching timeframes.
The indicator detects four institutional price action patterns in real time on these HTF candles: Candle Range Theory (CRT) trap candles signaling reversals, Expansion candles confirming momentum, Swing Point sequences marking structural turns, and Precision Swing Point (PSP) diamonds indicating cross-pair divergences. It also identifies SMT (Smart Money Technique) divergences between correlated instruments by comparing consecutive HTF candle pairs.
Correlated pairs are auto-detected for major forex pairs, metals, indices, and cryptocurrencies, with manual override options available. Additional features include a live countdown timer to the next HTF candle close, OHLC reference lines, vertical HTF open time separators, a compact dashboard showing HTF and intermediate timeframe bias and patterns, and customizable visual settings. The indicator supports multiple markets including forex, indices, and commodities.
Indikatorprofil
Indikatorkategorie
Marktstruktur (SMC)
Ausgabetyp
Visualisierung
Signale
Datenanforderungen
Tick-Daten

Kundenbewertungen

4.5
Bewertungen: 2
5
50 %
4
50 %
3
0 %
2
0 %
1
0 %
Kundenbewertungen
April 3, 2026
April 2, 2026

Diskussion

Häufig gestellte Fragen (FAQ)

Forex
Indices
Commodities
Über den cTrader Store verfügbare Produkte, einschließlich Handelsbots, Indikatoren und Plugins, werden von externen Entwicklern bereitgestellt und nur zu Informations- und technischen Zugriffszwecken verfügbar gemacht. cTrader Store ist kein Broker und erbringt keine Anlageberatung, persönlichen Empfehlungen oder eine Garantie für zukünftige Performance.

Mehr von diesem Autor

Indikator
SMC
Forex
+3
Fractal MSS with 4H Bias is a smart market-structure indicator designed to detect: Market Structure Shifts (MSS)
Indikator
SMC
EURUSD
+4
PSP is a professional-grade trading tool built to detect candle-level SMT divergence between correlated markets
Indikator
SMC
Forex
+3
Fractal MSS with 4H Bias is a smart market-structure indicator designed to detect: Market Structure Shifts (MSS)
Indikator
SMC
Forex
+1
Protected Swings identifies critical swing points where institutional money has likely "protected" their positions.
Indikator
Forex
BTCUSD
+9
synchronize scroll position and zoom levels across multiple charts. Perfect for multi-timeframe analysis
Indikator
SMC
Forex
+10
Identify high-probability reversal zones by detecting SMT divergences between correlated pairs in real time
Indikator
Key Levels
Liquidity Sweep
Visualize ICT Kill Zones, session highs/lows, midpoints & daily open across Asia, London and New York sessions.

Das könnte Sie auch noch interessieren

Indikator
RSI
Prop
+14
Unlock Stochastic RSI PRO in cTrader! Overlay RSI, highlight zones, and identify divergences with customizable settings.
Indikator
Signal
Indices
The **Whale Hunting Indicator** is a trading tool for **Boom & Crash and Volatility indices**, featuring **Auto Trend De
Indikator
RSI
SMC
+17
RSI, MACD, Stochastic, CCI & Momentum divergence scanner with confluence scoring. Never miss a signal again!
Indikator
Key Levels
Market Structure
+1
Sessions, ICT killzones, multi-ORB and previous levels. One clean, no-repaint cTrader overlay.
Indikator
EMA
Supertrend
+4
Dynamic dual MA cloud indicator. Identifies trends, crossovers, and pullback entries in real time for any asset.
Indikator
Shows BUY & SELL signals for 3 & 4 BAR PATTERN (Morning star/ Evening star). It is adjustable and it will SHOW ARROWS.
Indikator
AI
ATR
+26
Session Volume Profile + Composite. POC/VAH/VAL, Focus/Solo. Fast, clean, no ghosts, live-ready.
Indikator
ATR
EMA
+3
VMM Regime Flow Pro is an advanced quantitative market regime classifier, a real-time MARKOV Chain probability engine.
Indikator
SMC
Prop
+15
Auto-detects Swing Highs/Lows to draw dynamic Support & Resistance levels with break tracking.
Indikator
Forex
Crypto
+3
Perfect Trend
Indikator
MACD
Forecast future prices using historical MACD trends. Features a probability fan for smart entries and dynamic targets.
Indikator
ATR
Prop
+6
🟢 Strength-ranked S/R zones with MTF levels and Pro labels. Nearest-zone band and HUD for faster, cleaner entries. 🔴
Indikator
Signal
🔹 Trend-Reversal-Indicator for cTrader 🔹 The ultimate Renko chart tool!
Indikator
cTreder Smart SMA
Indikator
Prop
Forex
+11
🧭 See when your market tends to move—by Month, Day-of-Week, or Hour-of-Day🧭
Indikator
ADX
EMA
+4
A multi-timeframe dashboard for cTrader that scores trend direction, momentum, and strength across M15, H1, H4, and D1.
Indikator
Volume
Moving Average
Multi-Timeframe Rolling Volatility Indicator - Smart Volatility Breakout System
Indikator
Liquidity Sweep
A complete system for NASDAQ The tool that separates traders who "guess" from traders who operate like a professional.

Preis

2
Verkäufe