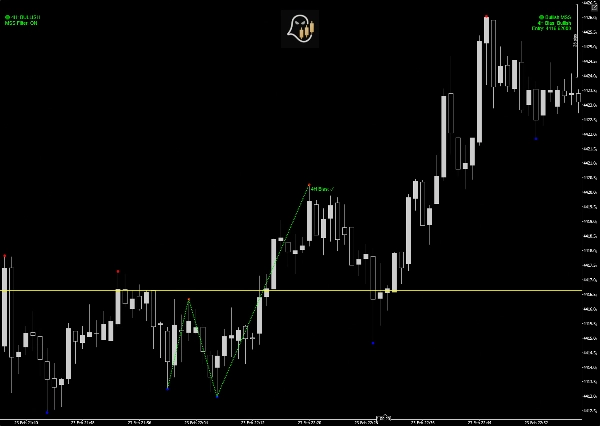
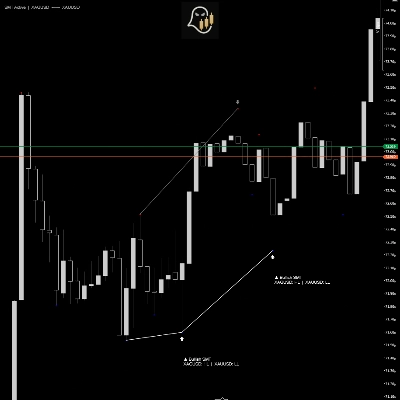
Wskaźnik wykrywa MSS (Market Structure Shift) wzorce zbudowane z fraktalnych szczytów i dołków.
Ważny MSS wymaga:
- Sekwencji 4 punktów zwrotnych fraktala
- Przełamania poprzedniej struktury zwrotnej
- Potwierdzenia w przeciwnym kierunku
- Opcjonalnego potwierdzenia z biasu 4H
Po wykryciu wskaźnik zapewnia:
- Wizualne linie wzorca
- Poziom wejścia Fibonacciego (50%)
- Panel alertów na wykresie
- Opcjonalny alert dźwiękowy
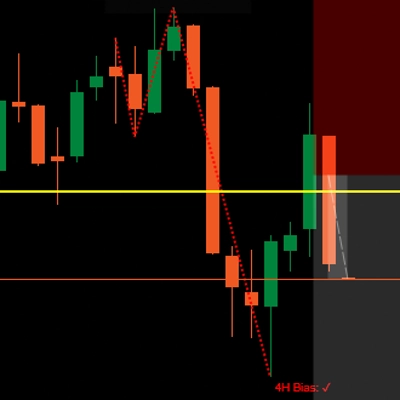
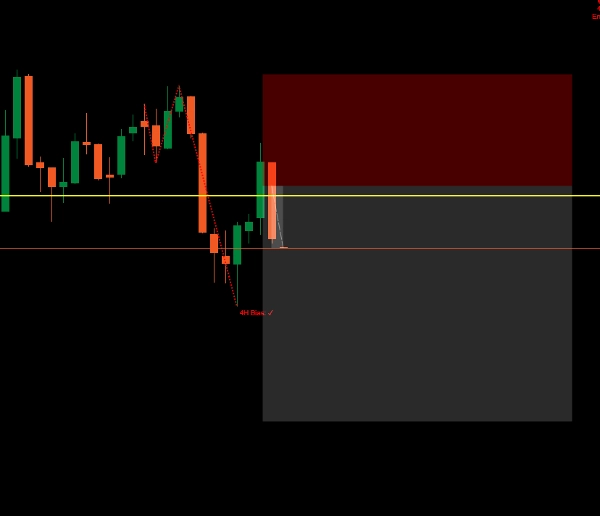
- Wyświetlanie kierunku biasu
FILTR BIASU 4-GODZINNEGO
Po włączeniu wskaźnik filtruje sygnały, używając poprzedniej świecy 4H.
- Bycza świeca 4H → wyświetlane tylko bycze MSS
- Niedźwiedzia świeca 4H → wyświetlane tylko niedźwiedzie MSS
Zapobiega to handlowaniu wbrew momentum wyższego interwału czasowego.
Bias jest aktualizowany automatycznie co kilka minut i wyświetlany na wykresie.
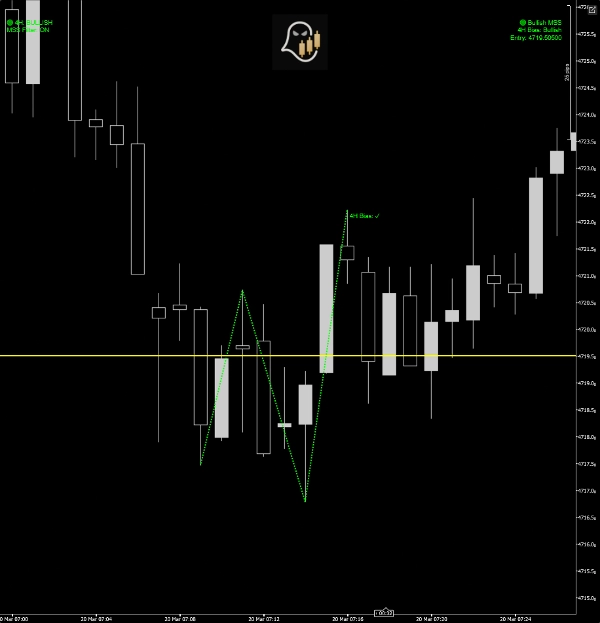
POZIOM WEJŚCIA FIBONACCIEGO
Po wykryciu MSS wskaźnik oblicza:
50% cofnięcie między dwoma ostatnimi punktami zwrotnymi
Ten poziom reprezentuje:
- Strefę ponownego wejścia instytucjonalnego
- Optymalny obszar cofnięcia
- Cena wejścia efektywna pod względem ryzyka
Poziom jest rysowany jako linia pozioma.
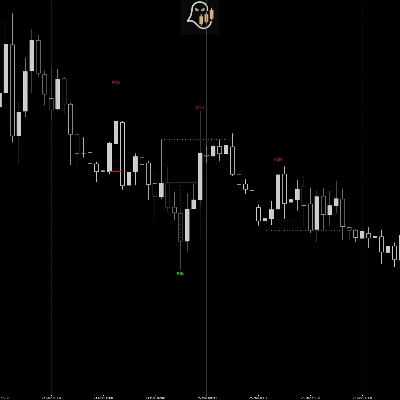
WIZUALNE WYJŚCIA
Gdy formuje się wzorzec, wskaźnik wyświetla:
✔ Linie wzorca
Łączy punkty zwrotne wizualnie
✔ Poziom 50% Fibonacciego
Strefa wejścia podświetlona na wykresie
✔ Panel wyświetlania biasu
Pokazuje aktualny kierunkowy bias 4H
✔ Panel alertów MSS
Wyświetla aktywny sygnał i poziom wejścia
✔ Alert dźwiękowy (opcjonalny)
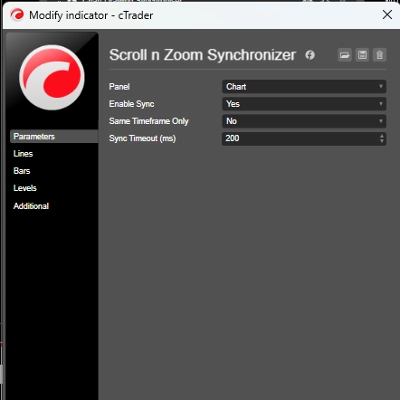
PARAMETRY WEJŚCIOWE
Okres fraktala
Kontroluje czułość punktów zwrotnych.
- Niższa wartość → więcej sygnałów
- Wyższa wartość → tylko silniejsze zwroty
Użyj filtru biasu 4H
Filtruje sygnały na podstawie wyższego interwału czasowego.
Zalecane: WŁ.
Pokaż alerty MSS
Wyświetla tekst sygnału na wykresie.
Dźwięk alertu
Odtwarza powiadomienie, gdy formuje się MSS.
Rysuj linie wzorców
Pokazuje strukturę wizualną na wykresie.
Wyłącz, jeśli chcesz tylko alerty.
JAK HANDLOWAĆ Z WSKAŹNIKIEM
Krok 1
Czekaj na wykrycie MSS.
Krok 2
Potwierdź zgodność biasu.
Krok 3
Oznacz poziom 50% Fibonacciego.
Krok 4
Czekaj, aż cena cofnie się do strefy.
Krok 5
Wejdź w kierunku MSS.
5 | 50 % | |
4 | 50 % | |
3 | 0 % | |
2 | 0 % | |
1 | 0 % |


![Logo „[Hamster-Coder] Pivot Points MTF”](https://cdn.ctrader.com/image/webp/4c143e5a-309c-40e3-a578-f04d1e133ffa_31159)

