Descrição
✨ Principais Características
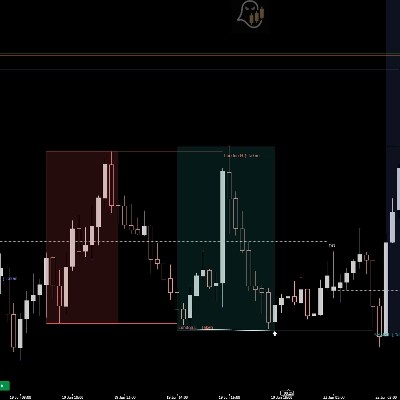
🔍 Detecção de Varredura de Liquidez
- Identifica automaticamente quando o preço ultrapassa níveis pivôs para capturar liquidez
- Distingue entre rompimentos genuínos e movimentos falsos (caça a stops)
- Destaca a zona exata onde a liquidez foi capturada
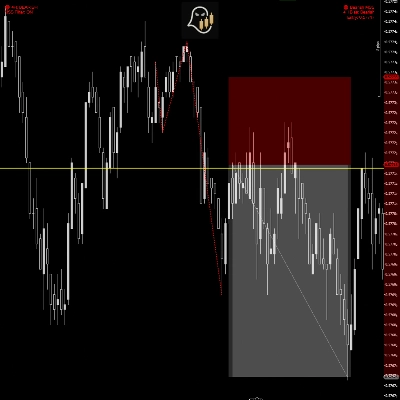
📦 Análise de Gap de Valor Justo (FVG)
- Detecta Gaps de Valor Justo altistas e baixistas em tempo real
- Acompanha a mitigação dos FVGs em múltiplos períodos de tempo
- Caixas visuais mostram gaps ativos e seu status de preenchimento
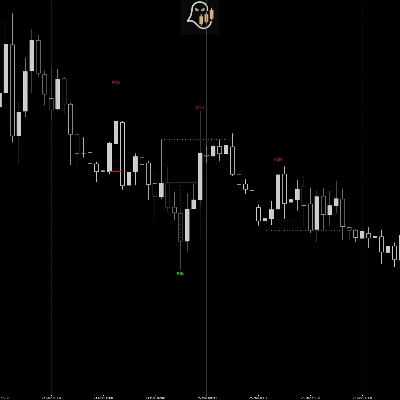
🎯 Identificação de Swing Protegido
- Marca Baixas de Swing Protegidas (PSL) e Altas de Swing Protegidas (PSH)
- Sinaliza apenas quando os swings seguem varreduras de liquidez OU mitigações de FVG
- Elimina ruído filtrando pontos de swing insignificantes
⚡ Lógica de Confirmação CISD
- Utiliza a metodologia "mudança no estado de entrega"
- Aguarda confirmação do preço acima/abaixo de níveis chave
- Invalida automaticamente setups quando stops são atingidos
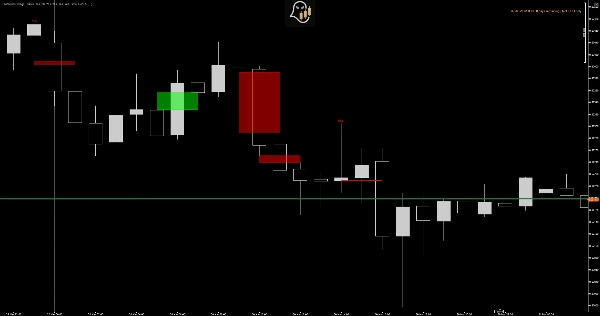
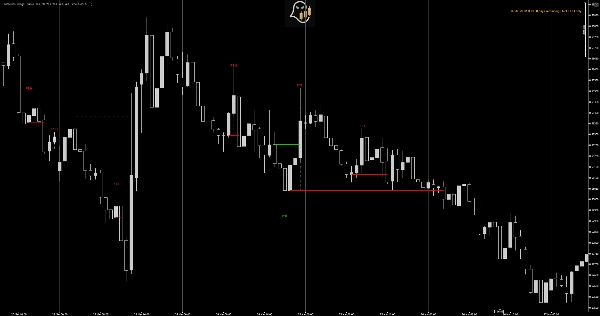
🎨 Visualização Profissional
- Exibição limpa e não intrusiva no gráfico
- Cores e transparência personalizáveis
- Dicas detalhadas mostrando o motivo de cada sinal
- Extensão automática de níveis para planejamento fácil de metas
💡 Por que Swings Protegidos?
O Problema com Indicadores Tradicionais
A maioria dos indicadores de swing marca todas as altas e baixas, criando poluição visual e sinais falsos. Eles não diferenciam entre flutuações aleatórias de preço e atividade institucional genuína.
A Solução dos Swings Protegidos
Ao exigir uma varredura de liquidez OU mitigação de FVG antes de marcar um swing, este indicador garante que você veja apenas setups onde o dinheiro inteligente mostrou sua mão. Isso melhora dramaticamente a qualidade dos sinais e reduz falsos rompimentos.
🚀 Como Funciona
1. Fase de Detecção
O indicador escaneia continuamente por:
- Altas e baixas pivôs (sensibilidade configurável)
- Varreduras de liquidez (movimentos apenas de pavio além dos pivôs)
- Gaps de Valor Justo (ineficiências de preço)
2. Formação do Swing
Quando um swing baixo/alto se forma E ele segue:
- Uma varredura de liquidez de um pivô anterior, OU
- O preço entrando em um Gap de Valor Justo, o indicador o marca como um swing protegido "pendente".
3. Fase de Confirmação (CISD)
O swing só é confirmado quando:
- Para PSL: O preço fecha acima do nível sem quebrar a baixa do swing
- Para PSH: O preço fecha abaixo do nível sem quebrar a alta do swing
4. Invalidação
Se o preço romper o ponto de swing antes da confirmação, o setup é descartado. Isso mantém seus gráficos limpos e foca apenas em setups válidos.
📈 Aplicações de Trading
Entradas de Continuação de Tendência
- PSLs em tendências de alta = oportunidades de compra com stops apertados
- PSHs em tendências de baixa = oportunidades de venda com risco definido
Trading de Reversão
- Múltiplos PSLs em níveis similares = zona forte de acumulação
- Múltiplos PSHs em níveis similares = zona de distribuição/resistência
Posicionamento de Stop Loss
- Coloque stops logo além dos PSLs confirmados para posições longas
- Coloque stops logo além dos PSHs confirmados para posições curtas
- Metodologia Stop Defended garante posicionamento ótimo de risco
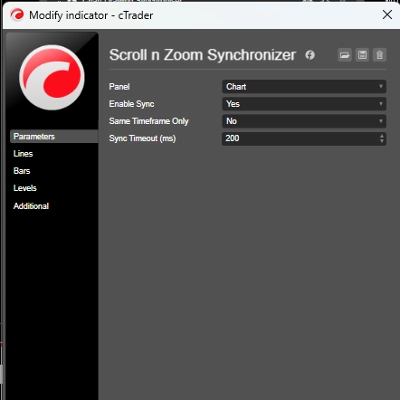
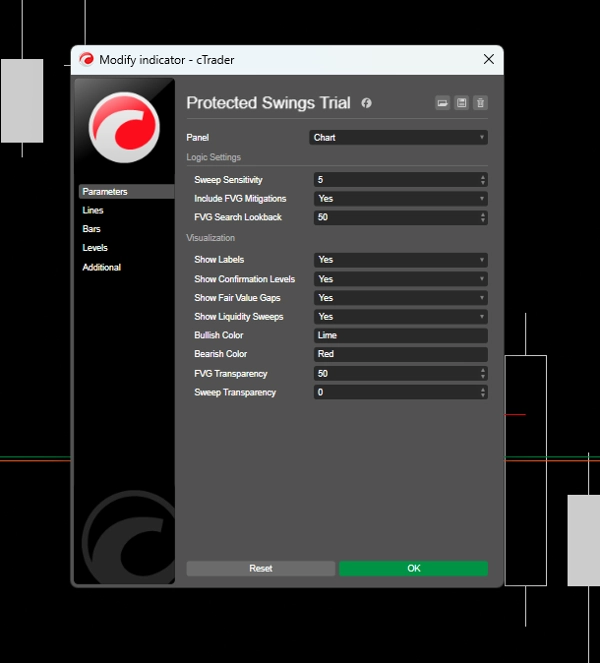
⚙️ Parâmetros Personalizáveis
Configurações de Lógica
- Sensibilidade da Varredura (1-20): Controla a importância do pivô - maior = menos mas sinais mais fortes
- Incluir Mitigações de FVG: Ativa/desativa sinais baseados em FVG
- Período de Busca do FVG: Por quanto tempo manter os FVGs ativos
### Visualização
- Mostrar Rótulos: Exibe marcadores PSL/PSH
- Mostrar Níveis de Confirmação: Desenha linhas horizontais nos níveis de entrada
- Mostrar Gaps de Valor Justo: Exibe caixas de FVG
- Mostrar Varreduras de Liquidez: Destaca zonas de varredura
- Cores Personalizadas: Personalização completa das cores para elementos altistas/baixistas
- Controles de Transparência:** Ajuste a intensidade visual conforme sua preferência
## ⚠️ Limitações da Versão de Teste
Esta é uma VERSÃO DE TESTE DE 7 DIAS com as seguintes restrições:
✅ O que está Incluído:
- Funcionalidade completa do indicador
- Todos os recursos desbloqueados
- Todos os períodos de tempo suportados no NZDUSD
- Personalização completa dos parâmetros
❌ Restrições:
- Símbolo: Funciona apenas em gráficos NZDUSD
- Duração: Período de teste de 7 dias a partir da instalação
- Suporte: Suporte limitado para teste
### 🔓 Benefícios da Versão Completa
- Funciona em TODOS os pares de moedas, ações, índices e commodities**
- Acesso vitalício - sem expiração
- Atualizações gratuitas para toda a vida
- Suporte prioritário do GhostInTheSpread
- Guia detalhado do usuário com estratégias de trading
- Tutoriais em vídeo e guias de configuração
Resumo
Avaliações de clientes
5 | 50 % | |
4 | 50 % | |
3 | 0 % | |
2 | 0 % | |
1 | 0 % |