HTF candles with Timeframe Alignment
Indicador
2 compras
Versão 2.0, Apr 2026
Windows, Mac
4.5
Avaliações: 2
Trading product for HTF candles with Timeframe Alignment Indicador Forex Indices, image 2
Trading product for HTF candles with Timeframe Alignment Indicador Forex Indices, image 3
Trading product for HTF candles with Timeframe Alignment Indicador Forex Indices, image 4
Trading product for HTF candles with Timeframe Alignment Indicador Forex Indices, image 5
Trading product for HTF candles with Timeframe Alignment Indicador Forex Indices, image 6
Trading product for HTF candles with Timeframe Alignment Indicador Forex Indices, image 7
2
Vendas

Descrição

Detector de Viés HTF — Edição Painel

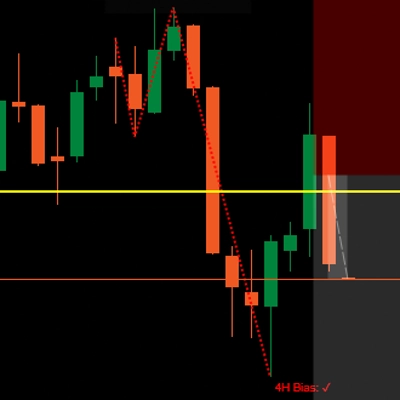
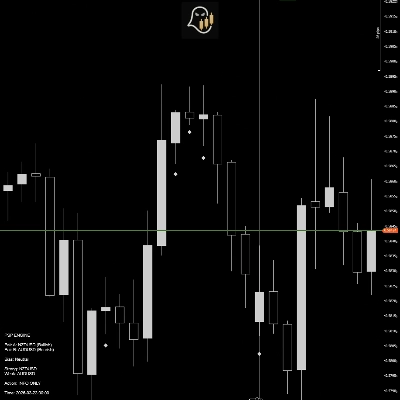
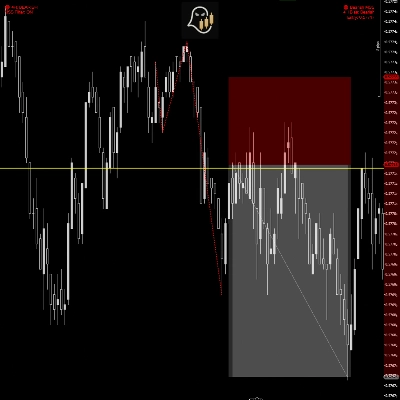
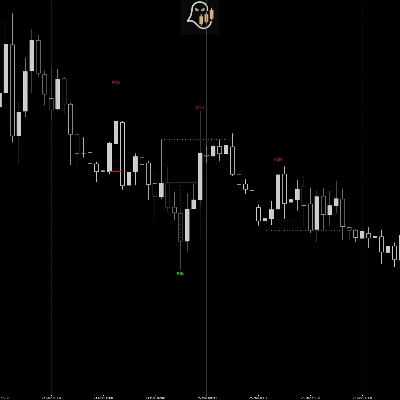
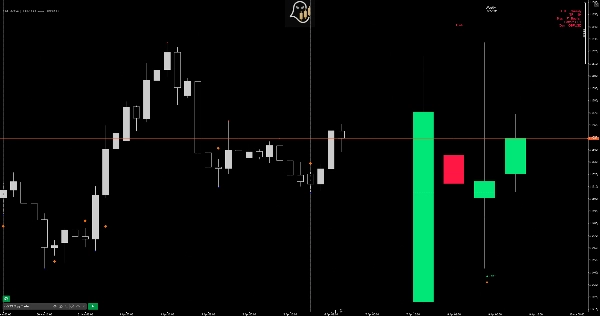
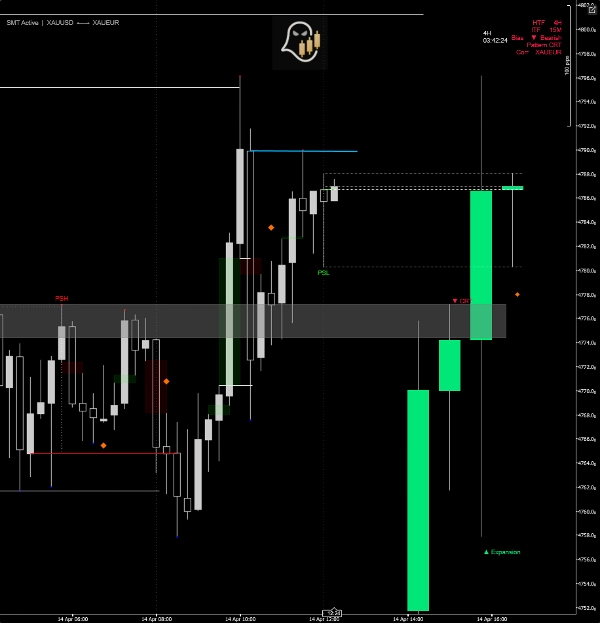
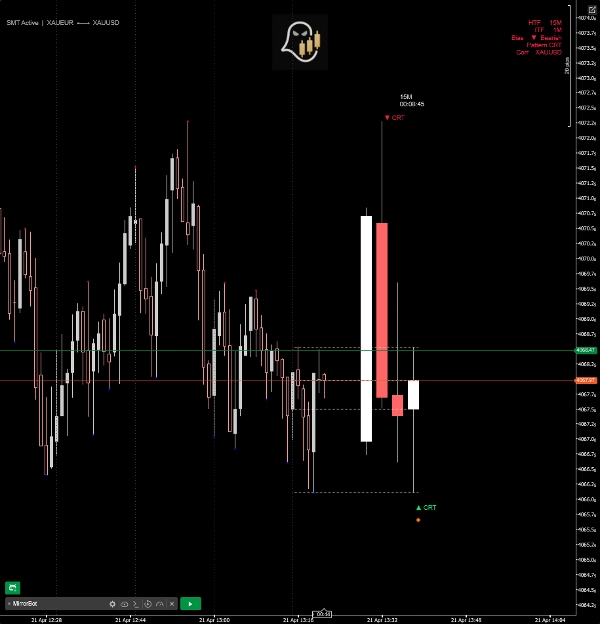
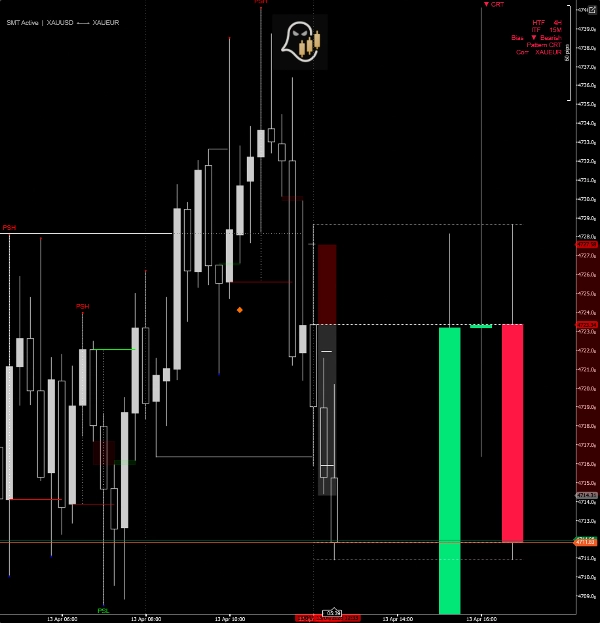
Veja a história do timeframe superior de relance. O Detector de Viés HTF exibe as últimas N velas do timeframe superior em um painel flutuante diretamente no seu gráfico — sem necessidade de mudar de timeframe — e identifica automaticamente o viés dominante usando quatro padrões institucionais de ação de preço.

Como Funciona

O indicador mapeia o timeframe atual do seu gráfico para seu timeframe natural superior (ex: 5M → 1H, 1H → Diário) e desenha essas velas HTF em um painel limpo ancorado à direita do preço. A detecção de padrões então ocorre nessas velas em tempo real.

Padrões Detectados

  • CRT (Teoria do Alcance da Vela) — identifica velas armadilha que varrem uma máxima ou mínima anterior e fecham de volta dentro dela, sinalizando uma provável reversão.
  • Expansão — sinaliza velas que englobam totalmente o alcance anterior e fecham além dele, confirmando o momentum direcional.
  • Ponto de Oscilação — detecta sequências de três velas onde uma vela de deslocamento é seguida por uma forte reversão, marcando um ponto estrutural de virada.
  • PSP (Ponto de Oscilação de Precisão) — sinal de divergência entre pares. Quando o símbolo principal e seu par correlacionado imprimem velas direcionais opostas na mesma barra HTF, um diamante PSP é plotado.

Divergência SMT (Painel HTF)

Compara pares consecutivos de velas HTF entre instrumentos correlacionados. Quando um par faz uma mínima mais baixa enquanto o outro faz uma mínima mais alta (ou vice-versa nas máximas), uma linha de divergência SMT é desenhada diretamente no painel com um rótulo direcional.

Detecção Automática de Par Correlacionado

Resolve automaticamente o instrumento correlacionado para o símbolo do seu gráfico — cobrindo os principais pares forex, metais, índices e cripto. Uma substituição manual também está disponível para emparelhamentos personalizados ou nomes de símbolos específicos de corretoras.

Recursos Adicionais

  • Contador regressivo ao vivo para o próximo fechamento da vela HTF
  • Linhas de referência pontilhadas OHLC para a vela HTF atualmente em formação
  • Separadores verticais no gráfico ao vivo alinhados aos horários de abertura HTF
  • Painel compacto mostrando HTF, ITF, viés detectado, nome do padrão e par correlacionado
  • Diamantes PSP ITF plotados diretamente nas barras do gráfico (timeframe atual)
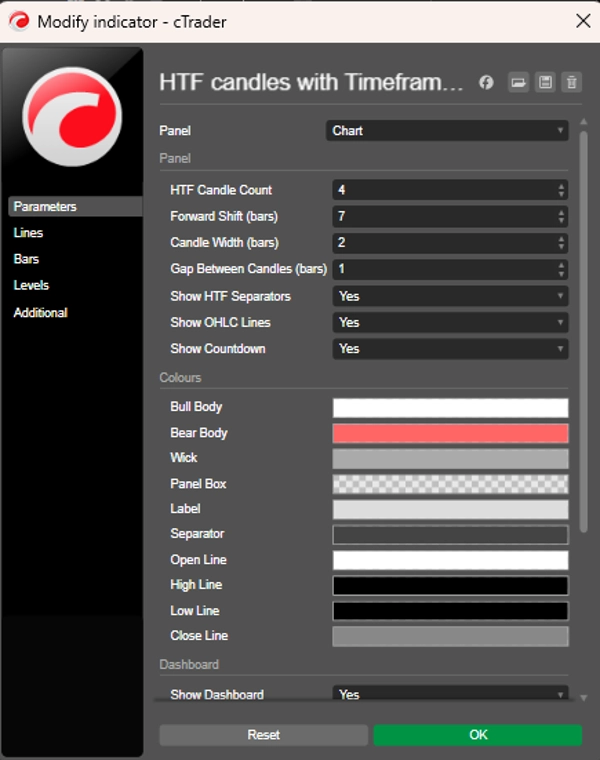
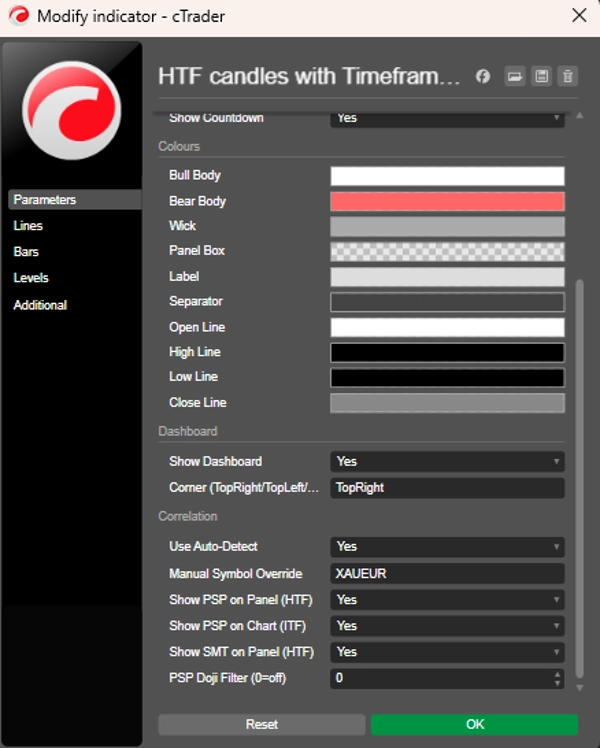
  • Cores, largura do painel, contagem de velas e posicionamento totalmente personalizáveis
  • Filtro Doji para suprimir sinais PSP fracos

Mapa de Timeframes

Gráfico TF Painel HTF

1M – 4M 15M

5M – 10M 1H

15M – 30M 4H

1H Diário

4H Semanal

Diário Mensal


Resumo

Resumo de IA
HTF Candles with Timeframe Alignment is a market structure indicator designed to display higher timeframe (HTF) candle data directly on your current chart via a floating panel. It automatically maps the chart’s timeframe to its natural higher timeframe (e.g., 5-minute to 1-hour, 1-hour to daily) and renders the last N HTF candles for quick visual reference without switching timeframes.
The indicator detects four institutional price action patterns in real time on these HTF candles: Candle Range Theory (CRT) trap candles signaling reversals, Expansion candles confirming momentum, Swing Point sequences marking structural turns, and Precision Swing Point (PSP) diamonds indicating cross-pair divergences. It also identifies SMT (Smart Money Technique) divergences between correlated instruments by comparing consecutive HTF candle pairs.
Correlated pairs are auto-detected for major forex pairs, metals, indices, and cryptocurrencies, with manual override options available. Additional features include a live countdown timer to the next HTF candle close, OHLC reference lines, vertical HTF open time separators, a compact dashboard showing HTF and intermediate timeframe bias and patterns, and customizable visual settings. The indicator supports multiple markets including forex, indices, and commodities.
Perfil do indicador
Categoria do indicador
Estrutura do mercado (SMC)
Tipo de resultado
Visualização
Sinais
Requisitos de dados
Dados de tick

Avaliações de clientes

4.5
Avaliações: 2
5
50 %
4
50 %
3
0 %
2
0 %
1
0 %
Avaliações de clientes
April 3, 2026
April 2, 2026

Conversa

Perguntas frequentes

Forex
Indices
Commodities
Os produtos disponíveis através da cTrader Store, incluindo bots de negociação, indicadores e plugins, são fornecidos por programadores terceiros e são disponibilizados apenas para fins informativos e de acesso técnico. A cTrader Store não é um corretor e não fornece aconselhamento em matéria de investimento, recomendações pessoais ou qualquer garantia de desempenho no futuro.

Mais deste autor

Indicador
SMC
Forex
+3
Fractal MSS with 4H Bias is a smart market-structure indicator designed to detect: Market Structure Shifts (MSS)
Indicador
SMC
EURUSD
+4
PSP is a professional-grade trading tool built to detect candle-level SMT divergence between correlated markets
Indicador
SMC
Forex
+3
Fractal MSS with 4H Bias is a smart market-structure indicator designed to detect: Market Structure Shifts (MSS)
Indicador
SMC
Forex
+1
Protected Swings identifies critical swing points where institutional money has likely "protected" their positions.
Indicador
Forex
BTCUSD
+9
synchronize scroll position and zoom levels across multiple charts. Perfect for multi-timeframe analysis
Indicador
SMC
Forex
+10
Identify high-probability reversal zones by detecting SMT divergences between correlated pairs in real time
Indicador
Key Levels
Liquidity Sweep
Visualize ICT Kill Zones, session highs/lows, midpoints & daily open across Asia, London and New York sessions.

Também poderá gostar de

Indicador
VWAP
NAS100
+5
Key NY session opens for NASDAQ (US100) & SP500 to find Tick Precise Entrys for High R:R intraday setups.
Indicador
Forex
Customizable multi-timeframe pivot point indicator for cTrader with alerts, Fibonacci, CPR, and more!
Indicador
Key Levels
Order Block
+3
Professional indicator for automated detection and dynamic tracking of Supply & Demand zones in cTrader.
Indicador
Signal
Scalping
Average accuracy of around 60% to 70% on 45min timeframes it is highly recommended to use stop losses
Indicador
Forex
BTCUSD
+5
Daily/Weekly/Monthly - Highs & Lows Indicator (Customizable Settings)
Indicador
AI
Grid
+17
Clean 3D, Sleek Candles for Trend Patterns.
Indicador
Order Block
Supply & Demand
+2
Professional MTF dashboard aggregating and clustering Supply & Demand zones from multiple timeframes in cTrader.
Indicador
ATR
Fibonacci
+4
Emperor Signals Pro is a premium non-repainting indicator for Forex pairs on the 15-minute timeframe
Indicador
ATR
Order Block
+5
Automated FVG & Order Block mapping with built-in trade playbook HUD & zero-lag performance.
Indicador
ATR
Forex
+6
The Smart Money Concepts indicator is an all-in-one overlay tool that automatically detects OB, FVG ecc..
Indicador
Volume
Key Levels
+1
Order book indicator .Don't trade against the flow. Trade with the truth!
Indicador
Prop
Forex
+11
🧭 See when your market tends to move—by Month, Day-of-Week, or Hour-of-Day🧭
Indicador
Prop
Forex
+3
Price Change Bundle 3-in-1 Levels • Bars • Histogram. Secret of Price Change
Indicador
Forex
Crypto
+4
Statistical boundaries that adapt to real-time volatility for a better risk management.
Indicador
ADX
EMA
+4
A multi-timeframe dashboard for cTrader that scores trend direction, momentum, and strength across M15, H1, H4, and D1.
Indicador
ATR
SMC
+19
Smart Liquidity Sweep detector with auto-drawing True Channels and real market structure mapping.
Indicador
Breakout
Allow trader to visualize Support & Resistance across different timeframes,give trader an overview of the current market
Indicador
BOS
MSS
+3
Advanced indicator to highlight key execution context and help aligning structure, location, and risk.

Preço

2
Vendas