
Descrição
Mapa de Correlação – Sua Ferramenta Essencial para Insights de Mercado
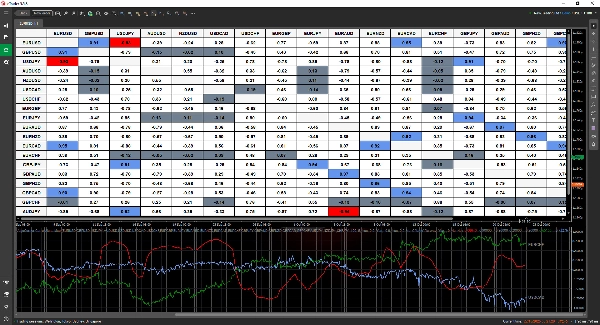
O Mapa de Correlação é um indicador poderoso e intuitivo projetado para ajudá-lo a descobrir relações entre ativos de relance. Com seu formato de tabela fácil de ler, você pode identificar rapidamente correlações e tomar decisões de negociação mais informadas.
✅ Personalize Sua Análise – Selecione e compare quantos pares de negociação sua plataforma permitir.
✅ Períodos Flexíveis – Analise correlações em qualquer período para adequar à sua estratégia.
✅ Exibição Clara e Adaptável – Escolha entre formatos decimal (-1 a 1) ou percentual (-100% a 100%).
✅ Destaque Inteligente – Identifique facilmente correlações fortes e fracas com codificação de cores personalizável.
✅ Alertas em Tempo Real – Mantenha-se à frente com notificações quando os valores de correlação mudarem significativamente.
✅ Dados Interativos – Clique em qualquer célula para acompanhar como as correlações evoluem ao longo do tempo.
✅ Melhorias Contínuas – Aproveite futuras atualizações sem custo adicional.
Descubra relações-chave do mercado e refine sua estratégia de negociação com o Mapa de Correlação! 🚀
Resumo
Key features include customizable display options with correlation values shown in decimal (-1 to 1) or percentage (-100% to 100%) formats, and smart color-coded highlighting to quickly identify strong or weak correlations. Users can interact with the data by clicking on any cell to track how correlations evolve over time. Real-time alerts notify users of significant changes in correlation values, aiding timely decision-making.
This tool is intended to help traders uncover relationships between assets efficiently, supporting more informed market analysis and strategy refinement.
Avaliações de clientes
5 | 67 % | |
4 | 33 % | |
3 | 0 % | |
2 | 0 % | |
1 | 0 % |


