
AlgoCorner Crosshair Edge
Indicador
Versão 1.0, Apr 2025
Windows, Mac
5.0
Avaliações: 1
Descrição
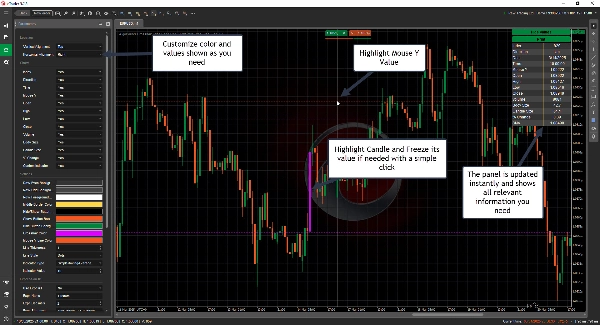
Crosshair Edge: A melhor ferramenta de visualização de dados do cTrader
Com Crosshair Edge, uma ferramenta robusta que melhora a visualização dos dados do mercado dentro da plataforma cTrader, você pode elevar sua análise de gráficos a novos patamares.
Interação Aprimorada com o Gráfico
- Destaque a barra atual e seu intervalo
- Congele o cursor em uma vela específica com um clique, e desbloqueie novamente com um clique quando necessário
- Envie valores para seu registro para que possam ser facilmente copiados
- Mostre ou oculte o layout conforme necessário
Personalização Completa
- Personalize as cores ao seu estilo
- Ajuste o cursor para qualquer local que precisar dentro do gráfico
- Selecione quais valores serão exibidos e quais devem ser omitidos
Exibição Instantânea de Dados da Vela
Basta passar o mouse sobre qualquer vela para verificar todos os seus detalhes e mais
- Índice
- Direção
- Data
- Hora
- Preço Y do Mouse
- Abertura
- Alta
- Baixa
- Fechamento
- Volume
- Tamanho do Corpo
- Tamanho da Vela
- % de Mudança
- Múltiplos valores de indicadores
-
- ADX
- ATR
- Fluxo de Dinheiro Chaikin
- EMA, HMA, SMA, TSMA, TMA, WMA
- Volume em Balanço
- RSI
- STD
- Fechamento Ponderado
- Suavização Welles Wilder
- Williams %R
- Desenhe Linhas Horizontais/Verticais com teclas de atalho fáceis
-
- Desenhar Linha Horizontal: Ctrl + 1
- Desenhar Linha Vertical: Ctrl + 2
- Teclas de atalho totalmente personalizáveis
- Fórmulas Personalizáveis
-
- Use Abertura, Alta, Baixa, Fechamento e Índice para calcular fórmulas que atendam às suas necessidades
- Exemplo, Preço Típico: (High[index] + Low[index] + Close[index])/3.0
Integração Perfeita
- Licença vinculada ao seu ID cTrader para facilidade de uso
- Atualizações futuras incluídas
Melhore sua experiência de negociação com o Crosshair Edge hoje! 🚀
Resumo
Perfil do indicador
Avaliações de clientes
5.0
Avaliações: 1
5 | 100 % | |
4 | 0 % | |
3 | 0 % | |
2 | 0 % | |
1 | 0 % |
Avaliações de clientes
Conversa
Perguntas frequentes
Indices
RSI
ATR
Os produtos disponíveis através da cTrader Store, incluindo bots de negociação, indicadores e plugins, são fornecidos por programadores terceiros e são disponibilizados apenas para fins informativos e de acesso técnico. A cTrader Store não é um corretor e não fornece aconselhamento em matéria de investimento, recomendações pessoais ou qualquer garantia de desempenho no futuro.


Preço
10
Vendas
346
Instalações gratuitas