
Descrição
MarketSessions – Sua Vantagem de Negociação, Visualizada
Transforme o Tempo do Mercado em Poder de Negociação
MarketSessions é um indicador profissional para cTrader que dá vida às sessões globais do mercado — para que você possa negociar onde o momentum é real e o timing se torna sua vantagem.
🚀 Por que os Traders Confiam no MarketSessions
Veja o Ritmo do Mercado
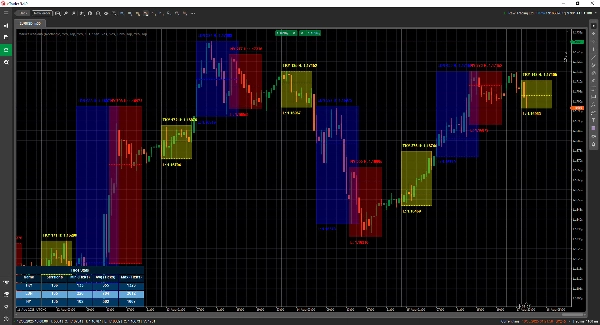
Visualize instantaneamente Londres, Nova York, Tóquio, Sydney – e qualquer outra sessão que desejar – com sobreposições limpas e elegantes que se adaptam ao seu gráfico.
Negocie de Forma Mais Inteligente, Não Depois
Receba notificações em tempo real quando as sessões abrirem, fecharem ou atingirem níveis-chave – entregues via Telegram ou Discord (sua escolha).
Ataque Zonas de Alta Probabilidade
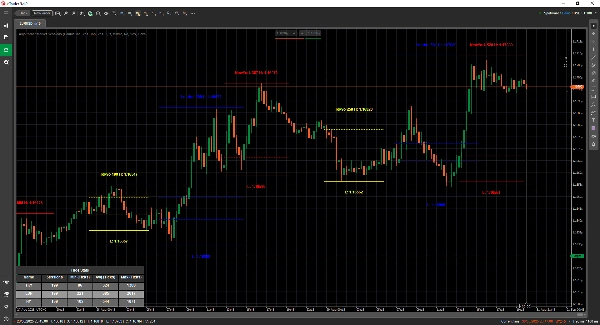
Aproveite ferramentas integradas como o Opening Range Breakout, Point of Control (POC) e linhas de sessão de precisão para que você nunca perca um rompimento ou rejeição.
🎯 Principais Recursos
- Visualização e Gestão de Sessões – horários, cores e etiquetas totalmente personalizáveis, mesmo para mercados sobrepostos
- Ferramentas Avançadas de Desenho – inclui desenhadores de Linha Dupla ❘❘ e Linha do Meio, retângulos de rompimento, marcadores de texto e um Modo de Linha Dupla para traders minimalistas
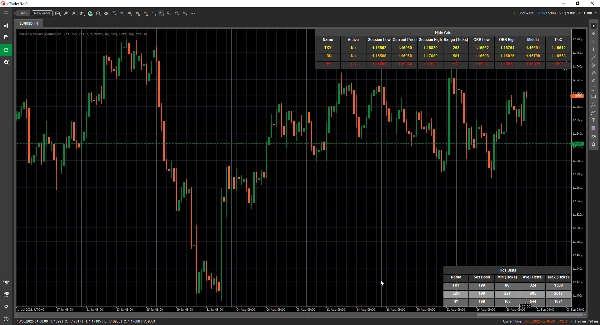
- Painel de Estatísticas – veja Total de Sessões, Min, Média e Máximas para cada sessão (em Ticks, Pips ou %)
- Modo Grade - permite visualizar as sessões ativas atuais em uma tabela, para que você possa ver as sessões em um timeframe maior.
- Configuração Flexível – personalize a posição do texto, modos de alcance, preferências de desenho e temas
- Alertas e Integrações – integração com Telegram/Discord com alertas sonoros e visuais
📦 O Que Você Recebe
- MarketSessions.algo (pronto para usar)
- Atualizações Vitalícias (sem taxas recorrentes)
- Suporte Amigável (acesso direto se precisar de ajuda)
💻 Requisitos
- plataforma cTrader
- runtime .NET 6.0
✅ Instale em minutos
✅ Negocie com confiança absoluta
📘 Referência de Parâmetros (Versão Amigável)
Lista de Sessões Disponíveis
- Nova York
- Londres
- Frankfurt
- Tóquio
- Hong Kong
- Xangai
- Singapura
- Wellington
- Sydney
- Toronto
Configurações Gerais
- Modo de Desenho – Escolha como as linhas da sessão são desenhadas no gráfico (Retângulo / Linha Dupla / Linha do Meio)
- Mostrar Nome da Sessão – Exibe o nome de cada sessão diretamente no seu gráfico
- Localização do Nome da Sessão – Decida onde o texto do nome da sessão aparece (topo, centro, inferior)
- Texto em Negrito – Deixa o nome da sessão em negrito para facilitar a leitura
- Deslocamento Superior do Texto – Adiciona espaçamento extra a partir do topo (para que o texto não sobreponha os candles)
- Deslocamento Inferior do Texto – Adiciona espaçamento extra a partir da parte inferior da área da sessão
- Localização do Tempo do Texto – Mostra o horário da sessão junto com o nome da sessão
- Usar Nome Curto da Sessão – Alterna para nomes mais curtos (ex: NY em vez de Nova York)
- Mostrar Alcance da Sessão – Destaca toda a faixa de preço coberta pela sessão
- Modo de Alcance da Sessão – Escolha como o alcance de preço é calculado (máximo/mínimo ou abertura/fechamento)
- Localização do Alcance da Sessão – Posicione o marcador de alcance no topo ou na base do alcance
- Mostrar Máximo – Exibe o preço mais alto da sessão
- Localização do Máximo – Escolha onde o rótulo de Máximo aparece
- Mostrar Mínimo – Exibe o preço mais baixo da sessão
- Localização do Mínimo – Escolha onde o rótulo de Mínimo aparece
- Estender Linhas de Máximo/Mínimo (Minutos) - Permite estender essas linhas para x minutos à frente
- Mostrar Breakout da Faixa de Abertura – Desenha uma caixa de breakout na abertura da sessão
- Estender Linhas ORB (Minutos) - Permite estender essas linhas para x minutos à frente
- Mostrar Linhas do Meio – Adiciona linhas médias para ajudar a identificar o valor justo
- Estender Linhas do Meio (Minutos) - Permite estender essa linha para x minutos à frente
- Mostrar PoC – Exibe o Point of Control (preço mais negociado da sessão)
- Estender Linhas do Meio (Minutos) - Permite estender essa linha para x minutos à frente
- Transparência do Preenchimento – Controle o quão transparente é o preenchimento de fundo da sessão
Estatísticas
- Desenhar Estatísticas – Mostrar/ocultar o painel de estatísticas no seu gráfico
- Alinhamento Horizontal das Estatísticas – Alinhar o painel (Esquerda / Centro / Direita)
- Alinhamento Vertical das Estatísticas – Escolha se o painel aparece no topo ou na base
- Cor do Título – Cor do texto para o título “Estatísticas”
- Cor das Linhas Pares – Cor de fundo para as linhas de número par no painel
- Cor das Linhas Ímpares – Cor de fundo para as linhas de número ímpar no painel
- Cor do Primeiro Plano – Cor do texto usada dentro do painel
Telegram
- Usar – Ativar ou desativar alertas do Telegram
- Token – Seu token do Bot do Telegram
- ChatId – O ID do chat onde os alertas serão enviados
Discord
- Usar – Ativar ou desativar alertas do Discord
- WebhookUrl – URL do webhook do Discord para envio de alertas de sessão
Alertas Sonoros
- Alerta Sonoro de Nova Sessão – Toca um som quando uma nova sessão começa
- Alerta Sonoro de Sessão Concluída – Toca um som quando uma sessão termina
Grade
- Forçar Grade - Força a renderização da grade independentemente do TimeFrame usado
- Grade Visível para TimeFrame Superior - Permite selecionar em qual TimeFrame e além dele esta Grade é visível
- Notificação em Caixa de Mensagem - Notifica por que o modo de renderização normal não é possível e muda para o Modo Grade
- Alinhamento Horizontal da Grade
- Alinhamento Vertical da Grade
Exemplo de Sessão (Nova York)
⚠️ Os mesmos parâmetros se aplicam a cada sessão (Londres, Tóquio, Sydney, etc.)
- Ativo – Ative ou desative esta sessão específica
- Cor – Cor da sessão usada no gráfico
- Preencher Região – Preenche o fundo da área da sessão
- Estilo da Linha – Escolha o estilo da linha (sólida, tracejada, etc.)
- Espessura da Linha – Controle a espessura das bordas da sessão
Faça do relógio do mercado seu aliado
Adquira o MarketSessions hoje e nunca mais perca uma sessão lucrativa.
Resumo
Users can view comprehensive session statistics, including total sessions, minimum, average, and maximum ranges measured in ticks, pips, or percentages. A grid mode enables viewing active sessions in a table format suitable for higher timeframes. The indicator supports real-time alerts via Telegram or Discord for session openings, closings, and key levels, complemented by sound and visual notifications.
Additional configurable options include display preferences for session names, price ranges, high/low prices, opening range breakouts, middle lines, and the Point of Control (most traded price). The indicator requires the .NET 6.0 runtime and offers lifetime updates and support. It is applicable to major forex symbols such as EURUSD, GBPUSD, NZDUSD, and USDJPY.
Avaliações de clientes
5 | 100 % | |
4 | 0 % | |
3 | 0 % | |
2 | 0 % | |
1 | 0 % |


